

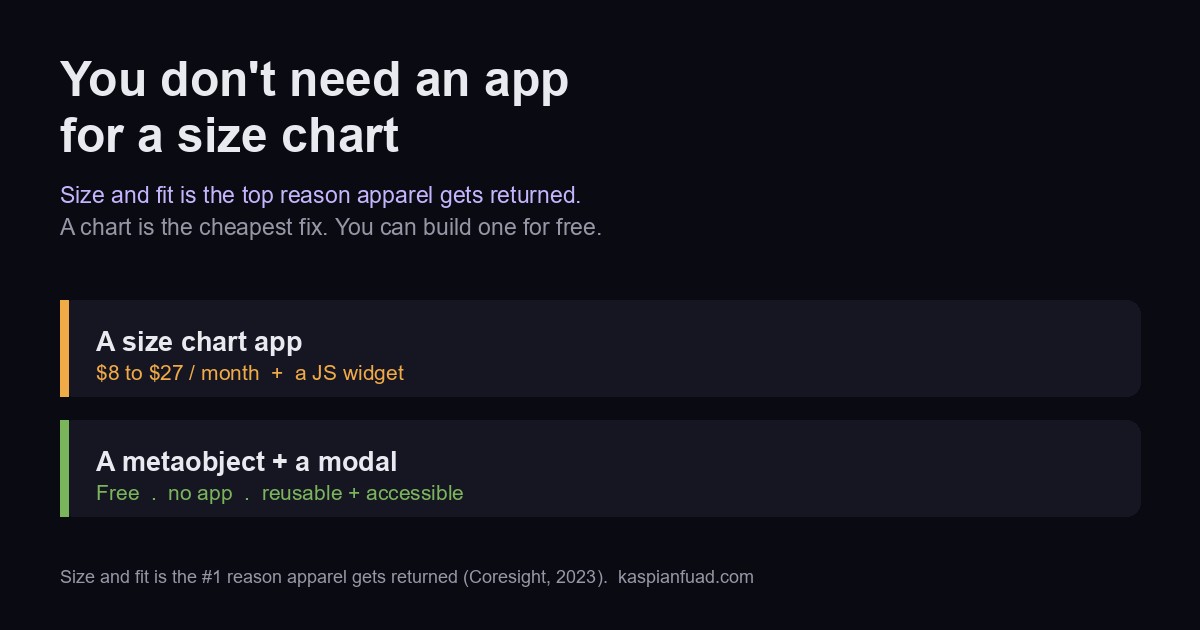
TL;DR: Size and fit is the top reason apparel gets returned, and a size chart is the cheapest way to cut that before checkout. You do not need a $7.99-to-$27-a-month app for one. Here is the reusable, accessible way: store the chart in a metaobject (define it once, attach it to many products), then show it in a small, properly accessible modal. Real HTML table, no app, no monthly fee, and it beats the usual tutorials on the two things they skip: reusability and accessibility.
The business case is simple. The NRF puts US ecommerce returns at 19.3 percent of online sales in 2025, and a 2023 Coresight Research survey commissioned by fit-tech vendor 3DLOOK found 53 percent of apparel brands and retailers named size or fit as the top reason for returns. A size chart is a direct, one-time fix for the single most common return reason, and one of the cheapest conversion wins on a product page. Paying a subscription for it is the part that does not add up.
Does Shopify have a native size chart?
No, and it is worth being precise, because the confusion sends people to the App Store. Shopify has no size-chart feature you toggle on. Its own pop-up size chart tutorial has you build one: create a metafield, attach a page, and wire it to the theme editor’s popup block, and it says plainly that this needs a theme with dynamic sources, with code edits for older themes. In other words, the building blocks are there, but Shopify does not hand you the recipe.
The right building block is the metaobject. Shopify’s developer docs define metaobjects as structured data you can “reference and reuse across your store,” and they explicitly list product size charts with multiple measurements as a use case. That reuse is the whole point: a metaobject lets you create one “Men’s tops” chart and attach it to every men’s top, instead of pasting the same image into 40 products. Every other tutorial I checked stops at a per-product image or page metafield, which does not scale and cannot hold a real table.
Why not just use a size chart app?
Because you would be renting a platform to get one table. The popular options are good apps: Kiwi Sizing is free for up to 3 charts, then $7.99 a month and up to $26.99 for higher tiers, and MP Size Chart, formerly Avada, sits in a similar range. They are built for stores that need dozens of charts, an AI size recommender, multi-language, or analytics.
If that is you, use one. But if you need a single static chart on a few product types, an app is a subscription plus an extra JavaScript widget on your storefront for something a metaobject and a few lines of Liquid do for free. It is a scope mismatch. The rest of this post is the free version, and it is more accessible than the widget most apps inject.
The reusable way: store the chart in a metaobject
Set this up once in the admin. It takes about five minutes.
- Create the metaobject: go to Settings, then Custom data, then Metaobjects, then Add definition. Name it
Size chart. Add three fields:heading(single line text),table(multi-line text), andnotes(multi-line text, optional). Thetablefield holds a plain HTML table, which is what makes the chart a real, reflowing, screen-reader-readable table instead of a flat image. - Add a product reference: go to Settings, then Custom data, then Products, then Add definition. Create a metafield named
Size chartwith namespace and keycustom.size_chart, and set its type to Metaobject reference, pointing at your Size chart definition. This is the link that lets you attach one chart to many products. - Create and attach charts: under Content, then Metaobjects, add an entry like “Men’s tops”, paste your table HTML into the
tablefield (template below), then open any product and set itsSize chartmetafield to that entry.
Here is a clean, accessible table to paste into the table field and edit. A real <table> with a header row is what screen readers announce as a table, and what reflows on a phone.
<table>
  <thead>
    <tr><th>Size</th><th>Chest (in)</th><th>Waist (in)</th><th>Length (in)</th></tr>
  </thead>
  <tbody>
    <tr><td>S</td><td>36 to 38</td><td>28 to 30</td><td>28</td></tr>
    <tr><td>M</td><td>39 to 41</td><td>31 to 33</td><td>29</td></tr>
    <tr><td>L</td><td>42 to 44</td><td>34 to 36</td><td>30</td></tr>
    <tr><td>XL</td><td>45 to 47</td><td>37 to 39</td><td>31</td></tr>
  </tbody>
</table>
The code: one snippet, no app
Create snippets/size-chart.liquid and paste this in. It renders a “Size chart” button and an accessible modal, but only when the product has a chart attached, so products without one show nothing.
{%- comment -%}
Reusable size chart, no app. Reads the size_chart metaobject linked via the
product metafield custom.size_chart and shows it in an accessible modal.
Render it next to your buy buttons, and pass the product:
{% render 'size-chart', product: product %}
{%- endcomment -%}
{%- assign chart = product.metafields.custom.size_chart.value -%}
{%- if chart -%}
{%- assign sc_id = 'size-chart-' | append: product.id -%}
<button type="button" class="size-chart-btn" aria-haspopup="dialog" aria-controls="{{ sc_id }}" data-size-chart-open="{{ sc_id }}">
<svg width="16" height="16" viewBox="0 0 24 24" fill="none" stroke="currentColor" stroke-width="2" aria-hidden="true"><path d="M3 7h18M3 12h18M3 17h18M7 7v3M12 7v5M17 7v3"/></svg>
Size chart
</button>
<div id="{{ sc_id }}" class="size-chart" role="dialog" aria-modal="true" aria-labelledby="{{ sc_id }}-title" hidden>
<div class="size-chart__overlay" data-size-chart-close></div>
<div class="size-chart__dialog" tabindex="-1">
<div class="size-chart__head">
<h2 id="{{ sc_id }}-title" class="size-chart__title">{{ chart.heading | default: 'Size chart' }}</h2>
<button type="button" class="size-chart__close" data-size-chart-close aria-label="Close size chart">×</button>
</div>
<div class="size-chart__body">
{{ chart.table }}
{%- if chart.notes != blank -%}<div class="size-chart__notes">{{ chart.notes }}</div>{%- endif -%}
</div>
</div>
</div>
<script>
(function () {
var id = {{ sc_id | json }};
var modal = document.getElementById(id);
if (!modal || modal.dataset.scInit) { return; }
modal.dataset.scInit = '1';
// Move the modal to <body> so a transformed ancestor can't clip the overlay.
document.body.appendChild(modal);
var dialog = modal.querySelector('.size-chart__dialog');
var last = null, inerted = [];
function tabbable() {
return modal.querySelectorAll('a[href], button:not([disabled]), [tabindex]:not([tabindex="-1"])');
}
function open() {
last = document.activeElement;
modal.hidden = false;
document.body.style.overflow = 'hidden';
// Make the rest of the page inert, so screen readers cannot reach it either.
inerted = [];
Array.prototype.forEach.call(document.body.children, function (el) {
if (el !== modal && !el.hasAttribute('inert')) { el.setAttribute('inert', ''); inerted.push(el); }
});
(tabbable()[0] || dialog).focus();
document.addEventListener('keydown', onKey);
}
function close() {
modal.hidden = true;
document.body.style.overflow = '';
inerted.forEach(function (el) { el.removeAttribute('inert'); });
inerted = [];
document.removeEventListener('keydown', onKey);
if (last && last.focus) { last.focus(); }
}
function onKey(e) {
if (e.key === 'Escape') { close(); return; }
if (e.key !== 'Tab') { return; }
var f = tabbable();
if (!f.length) { return; }
var first = f[0], lastEl = f[f.length - 1];
if (e.shiftKey && document.activeElement === first) { e.preventDefault(); lastEl.focus(); }
else if (!e.shiftKey && document.activeElement === lastEl) { e.preventDefault(); first.focus(); }
}
Array.prototype.forEach.call(document.querySelectorAll('[data-size-chart-open="' + id + '"]'), function (b) { b.addEventListener('click', open); });
Array.prototype.forEach.call(modal.querySelectorAll('[data-size-chart-close]'), function (b) { b.addEventListener('click', close); });
})();
</script>
{% stylesheet %}
.size-chart-btn { display: inline-flex; align-items: center; gap: 0.4rem; background: none; border: 0; padding: 0.35rem 0; font: inherit; color: currentColor; text-decoration: underline; text-underline-offset: 3px; cursor: pointer; }
.size-chart[hidden] { display: none; }
.size-chart { position: fixed; inset: 0; z-index: 1000; display: flex; align-items: center; justify-content: center; padding: 1rem; }
.size-chart__overlay { position: absolute; inset: 0; background: rgba(0, 0, 0, 0.55); }
.size-chart__dialog { position: relative; background: #ffffff; color: #141414; width: min(560px, 100%); max-height: 85vh; overflow: auto; border-radius: 12px; padding: 1.25rem 1.4rem; box-shadow: 0 20px 60px rgba(0, 0, 0, 0.35); }
.size-chart__head { display: flex; align-items: flex-start; justify-content: space-between; gap: 1rem; margin-bottom: 0.75rem; }
.size-chart__title { margin: 0; font-size: 1.15rem; }
.size-chart__close { background: none; border: 0; font-size: 1.7rem; line-height: 1; cursor: pointer; color: inherit; padding: 0 0.25rem; }
.size-chart__body table { width: 100%; border-collapse: collapse; }
.size-chart__body th, .size-chart__body td { border: 1px solid rgba(0, 0, 0, 0.12); padding: 0.5rem 0.65rem; text-align: left; }
.size-chart__notes { margin-top: 0.9rem; font-size: 0.92rem; opacity: 0.8; }
{% endstylesheet %}
{%- endif -%}
Then render it once on the product page, next to the variant picker or the add-to-cart button, where a shopper looks for it: add {% render 'size-chart', product: product %} to your product template or main product section. Do this on a duplicate or development theme first, never the live one.
How do I make the size chart popup accessible?
This is the part every thin tutorial skips, and it is where a size-chart popup either works for everyone or traps keyboard and screen-reader users. The code above follows the WAI-ARIA dialog pattern:
- Announced as a dialog:
role="dialog"andaria-modal="true"tell assistive tech that everything behind it is inert, andaria-labelledbypoints at the visible title so the dialog has a name. - Focus moves in, and stays: when the button is pressed, focus moves into the dialog, and Tab and Shift+Tab wrap around inside it instead of leaking back to the page behind.
- Escape closes, focus returns: pressing Escape or the close button dismisses the modal and returns focus to the “Size chart” button that opened it, so a keyboard user does not lose their place.
None of that needs a library. It is about 30 lines of vanilla JavaScript, and it is the difference between a popup that passes an accessibility audit and one that fails it.
How do I keep it fast?
There is almost nothing to keep fast, which is the point. The chart data comes from Liquid at render time, so there is no app SDK and no network request. The only JavaScript is the modal behavior, which runs on click, not on load, so it costs nothing on your Largest Contentful Paint. The modal starts with the hidden attribute, so it never flashes or shifts layout. Compared to a size-chart app that injects a widget on every product page, this is the version that shows up as a rounding error in your Core Web Vitals. It is the same pattern as building recently viewed products without an app.
Download the Size Chart Code Cheat Sheet (PDF)
The takeaway
- Shopify has no native size chart. The building blocks (metaobjects) are there, but you assemble it yourself, which is why people reach for an app.
- Size and fit is the leading reason apparel gets returned, so a clear chart is a direct CRO win against your most common return, and there is no reason to pay monthly for it.
- Store the chart in a metaobject and reference it from a product metafield, so one chart attaches to many products. That reuse is what per-product image tutorials miss.
- Use a real HTML table, not an image, so the chart reflows on mobile and screen readers can read it.
- Make the modal accessible: role, focus trap, Escape, and focus return. It is 30 lines of vanilla JS, and it is the bar most size-chart tutorials fail.
I keep writing these because the App Store’s answer to a one-table feature is a subscription and a widget, and the free version is usually both faster and more accessible. If there is another app you are paying for that you suspect is a snippet in disguise, tell me and I will take it apart.