

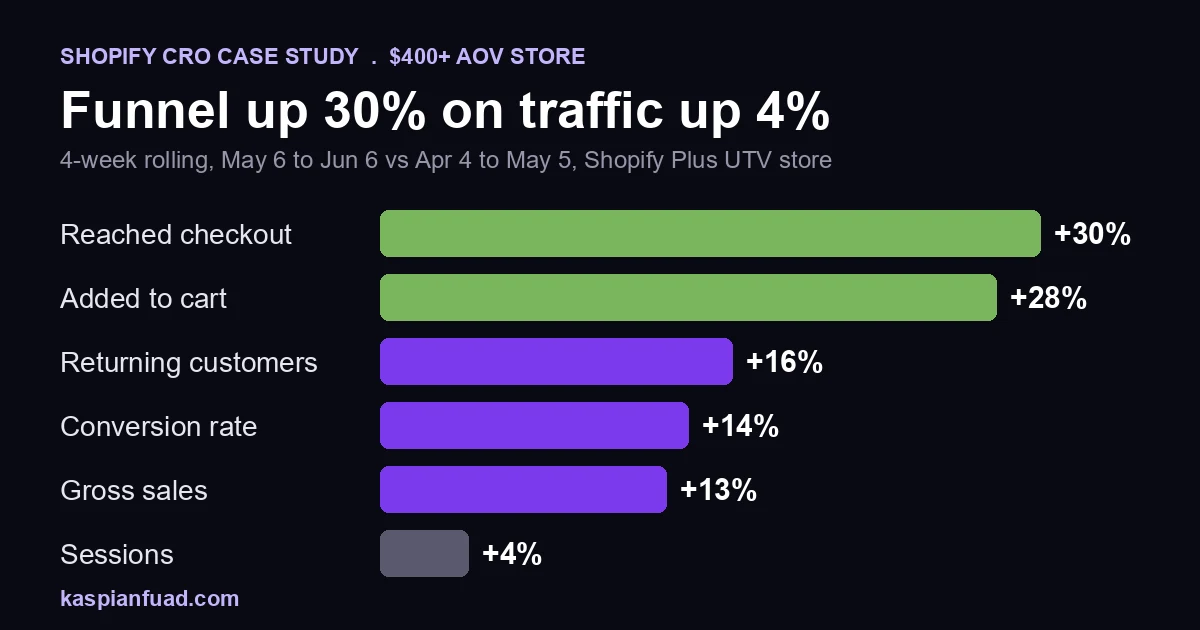
TL;DR: WD Electronics sells $400 to $2,000 UTV kits on Shopify Plus. After weekly CRO sprints, the 4-week rolling funnel showed reached checkout +30%, added to cart +28% and conversion rate +14%, while sessions rose only 4%. Below: the dates, the funnel, what each sprint shipped, and what these numbers do not prove.
I asked ChatGPT for real Shopify CRO case studies on high-ticket stores. It came back with a furniture replatform, a Shopify Plus migration and a jewelry rebuild, then gave a warning I agree with: most of those lifts came from rebuilds, several had “baseline not disclosed,” and a buyer should demand the baseline, the funnel and the date ranges before hiring anyone.
So here is one where nothing is hidden. Derek Burgener runs WD Electronics, a UTV lighting and accessory store with an average order around $450. I have worked on it weekly since April 2026. Every number below comes from Shopify analytics, Microsoft Clarity, Lighthouse or Search Console, with the window it covers.
Download the CRO case study vetting checklist (PDF)
Why this matters for your store
- A high-ticket store converting at 0.7% can look broken on a benchmark chart while its real leak sits in one funnel step worth thousands a week.
- A CRO case study with no baseline or dates cannot be checked, and you are about to spend $3,000 to $4,000 a month on the person who wrote it.
- Funnel steps like reached checkout move in weeks; revenue needs a month to read, which decides how you judge the first invoice.
What did the store look like before any work?
The audit came first. Mobile Lighthouse scored 41/100, lab LCP was 9.3 seconds and CLS was 0.9, so buttons moved under the buyer’s thumb while the page loaded. Search for “RZR,” the most common query on a Polaris accessories store, returned an $80 battery, headlights and blog posts instead of the $400 to $600 kits people wanted.
The checkout had a quieter problem. A $578 order showed $607.97 at checkout because package protection ($29.97) was added to the total without a clear opt-in. Baymard’s research puts extra costs too high at 40% of abandonment reasons, and on a $578 kit a surprise $30 is exactly that.
Microsoft Clarity told the rest. In the first measured week, 93.9% of sessions hit a JavaScript error, scroll depth averaged 42.16%, and 13.31% of visits were quick back clicks. Checkout abandonment was 62.9%.
None of that needed a new theme. It needed the existing one to stop fighting the buyer.
What did each weekly sprint ship?
The engagement runs on a fixed cadence: a cross-source audit at the start of the week, a prioritized sprint against it, and a Friday review that sets the next one. The retainer post covers what that costs. Here is what the first three sprints actually shipped.
Sprint 1 (April 12 to 17): baseline and a landing page
A 10-section paid social landing page Derek’s team can edit in the theme editor, a fix for a bug that added the wrong variant to cart on accessory products, and the first measurement baseline. Nothing clever. The baseline is what makes every later claim checkable.
Sprint 2 (April 21 to 25): JavaScript errors and the mobile PDP
A theme function called calculatesubtotalwithdiscount was undefined and throwing on 190 sessions. Fixing it, plus srcset and lazy loading on product images, produced the biggest single-week swing of the engagement:
| Metric | Week 1 | Week 2 | Change |
|---|---|---|---|
| Conversion rate | 0.73% | 0.81% | +11% |
| AOV | $391.66 | $438.35 | +12% |
| Mobile LCP (lab) | 2.06s | 0.736s | -64% |
| Checkout abandonment | 62.9% | 49.5% | -13.4 pts |
| JS error sessions | 93.9% | 41 sessions | near zero |
| Scroll depth | 42.16% | 64.55% | +53% |
Sprint 3 (April 28 to May 2): the cart drawer and a selector bug
The cart drawer got a sticky footer so Secure Checkout stays above the fold, and a 36 by 36 pixel Remove control. Checkout abandonment fell another 6.3 points to 43.2%, and completed checkouts rose 13% week over week. I wrote up the drawer rebuild in detail in the cart drawer vs cart page post.
The selector fix mattered more than it looks. The year-make-model page hard-redirected to a product whenever a vehicle matched one kit, which hit 243 of 1,131 combinations (21.5%). Buyers landed on a product page they had not chosen. A summary step now lets them click View Kit on purpose. If you sell parts by vehicle, the fitment selector build shows the pattern.
What moved after two months of sprints?
Single weeks at 0.6% conversion are noisy, so the number I report to Derek, and to you, is a 4-week rolling comparison: May 6 to June 6 against April 4 to May 5.
| Metric | Value (May 6 to Jun 6) | Change vs prior 4 weeks |
|---|---|---|
| Sessions | roughly flat | +4% |
| Added to cart rate | 2.4% | +28% |
| Reached checkout rate | 1.35% | +30% |
| Conversion rate | 0.62% | +14% |
| Gross sales | $492,184 | +13% |
| Returning customer rate | 29.06% | +16% |
Shopify defines both funnel rates as sessions with the action divided by all sessions, so a 30% rise on a 4% traffic rise means more of the same visitors moved forward. The funnel did the work, not the traffic.
Performance held while the work compounded. A server-rendered free-shipping bar and a reserved cart-list height took Lighthouse cart CLS from 0.488 to 0.001. Field data from real Chrome users showed INP between 69ms and 87ms and CLS between 0.01 and 0.05 on the product, selector and cart pages, all inside Google’s good bands for INP (200ms) and CLS (0.1). The homepage LCP still sits near 3 seconds in the field, over the 2.5 second line, and I have parked it because the funnel pages mattered more.
Is 0.62% conversion bad for a $450 AOV store?
No, and this is where most benchmark posts mislead high-ticket owners.
Littledata puts the average Shopify add to cart rate at 4.6%. WD runs 2.4% after a 28% improvement, because a UTV owner adds a $578 turn signal kit after reading forums and comparing SuperATV, not on the first visit. The conversion rate looks low for the same reason.
The honest benchmark for a high-ticket store is your own trend, plus two ratios that do not care about price: reached checkout divided by added to cart, and checkout abandonment. On WD, checkout abandonment going from 62.9% to 43.2% in three weeks said more about the store’s health than any cross-category average could.
What these numbers do not prove
I would ask these questions of anyone’s case study, so I will answer them for mine.
There was no holdout group. These are before-and-after windows, not an A/B test, so I cannot isolate each change. April to June is also riding season for UTV owners, and seasonal demand can lift conversion by itself.
Two things argue against pure seasonality. Sessions rose only 4% while reached checkout rose 30%, and the biggest moves (abandonment down 13.4 points, JS error sessions from 93.9% to near zero) landed in the exact week their fix shipped. Clarity behavior metrics like rage clicks (22 to zero) do not care about season.
Channels also moved. Bing organic sales grew and Facebook social sales rose 75% in sprint 3, and the landing page from sprint 1 fed paid traffic. I report store-wide numbers because that is what Derek pays for, but some of the gross sales lift belongs to channels, not the funnel. The funnel rates are the cleaner signal, which is why I lead with them.
How to check any CRO case study before you hire
Use this on me or on anyone else. A case study that passes these five checks is evidence; one that fails them is marketing.
- Baseline and ending value, not only a percentage. “+47%” with no starting number could be 0.1% to 0.15%.
- Exact date ranges, and whether the windows are equal length. An 11-day window against the prior 11 days is fine; a Black Friday week against a February week is not.
- Session count or change. A conversion lift during a traffic drop, or revenue up on doubled ads, tells you nothing about the work.
- Funnel steps, at minimum added to cart, reached checkout and checkout abandonment. They show where the lift came from.
- What shipped in each window. If nobody can say what changed the week a metric moved, the metric moved on its own.
The PDF above turns these into a one-page checklist, plus the full WD funnel scorecard so you can see what a passing case study looks like. If you want the longer version from the first sprint, the Mobelglede teardown shows a store starting from a 0.11% baseline, which is a very different starting point from WD’s.
How to verify your own funnel in 5 minutes
Open Shopify analytics for the last 28 days and the 28 days before. Write down added to cart rate, reached checkout rate and sessions for both windows. If reached checkout divided by added to cart sits under 0.5, the cart is your leak; if added to cart is flat while sessions climb, the product page is. Then run your own site through the CrUX grader to see whether real-user Core Web Vitals are part of the problem.
If you would rather hand that read to someone, send the store URL through the contact form and I will reply with the first three things I would fix, the same way the WD audit started.
The takeaway
- Demand the baseline and the dates before you trust any CRO lift, including mine.
- Judge a high-ticket store by its funnel rates, not by a cross-category conversion average.
- Fix JavaScript errors and cart friction first; on WD they moved abandonment 19.7 points in three weeks.
- Read results on a 4-week rolling window, because single weeks at 0.6% conversion lie in both directions.
- Separate channel growth from funnel growth; sessions up 4% with reached checkout up 30% is the pattern that proves the work.
I am Kaspian Fuad, a Shopify developer and CRO consultant. I publish the baseline, the dates and the caveats for every engagement I can talk about. If your store sells $300+ products and the funnel feels stuck, book a call and bring your last 28 days of added to cart and reached checkout rates.