

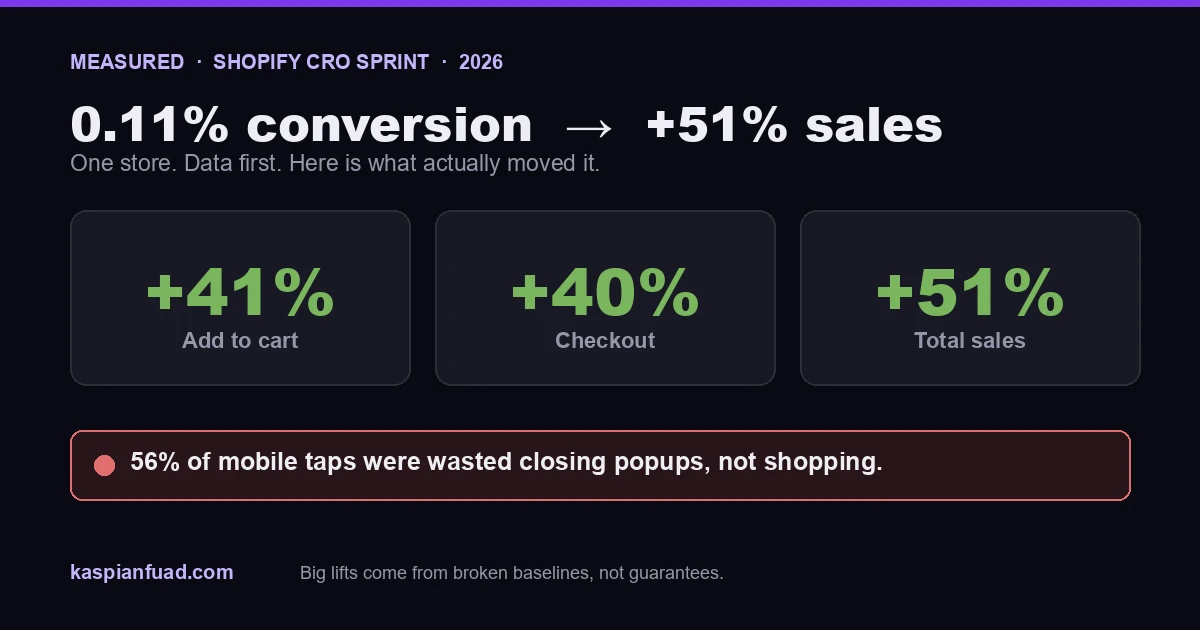
TL;DR: A Norwegian used-furniture store was converting at 0.11% on mobile, a tenth of what a Shopify store should do. Before I wrote any code, I read the behavioral data, and it was brutal: 56% of all mobile taps were spent closing cookie and email popups, not shopping. I killed the popup friction, added a trust-first product page, a real savings badge, and a sticky add-to-cart. The result over 30 days: add-to-cart +41%, checkout +40%, total sales +51%. Here is the full teardown, and an honest answer to whether a lift like that is realistic for your store.
I would rather show you real numbers than list generic tips. This is one store, Mobelglede, and the whole point is that the biggest wins came from removing friction the owner did not know was there. None of it was a redesign.
What was actually broken?
The store was spending on Meta ads and converting almost nobody. Mobile was 75% of traffic, and 56% of sessions arrived through Meta’s in-app browser, which mangles cookies and rendering. Mobile conversion sat at 0.11%, and the add-to-cart rate was 1.6% against a Shopify average near 4.6%. In a 3-day sample of 893 real sessions, six ended in an add-to-cart. Six.
A 0.11% conversion rate is not a tuning problem, it is a wall. When a store is that far below the roughly 1.4% Shopify average, the job is not to optimize, it is to find what is physically stopping people from buying.
Why I read the data before touching the code
Most CRO advice is a list of best practices applied blind. I do the opposite. Before a single commit, I installed Microsoft Clarity and let it record real sessions, then read the heatmaps. Two findings explained almost the entire failure.
First, scroll depth: 21% of mobile visitors left before they reached the add-to-cart button, and by the halfway point a third were gone. Second, and this is the one that stops you cold, the click heatmap showed that 56% of all mobile taps were spent dismissing a full-screen cookie consent modal and an email popup. More than half of every interaction on the store went to closing overlays instead of looking at products. You cannot buy a sofa while you are fighting a popup. The data, not my opinion, directed the whole sprint. I use the same lens when I compare session-recording tools.
The changes that actually moved the number
The 5-day audit produced 43 findings, 15 of them critical. I shipped them in priority order across an 87-commit sprint. The ones that moved the metric:
- Killed the popup friction. The full-screen cookie modal became a small bottom-bar notice, and the email popup was disabled on product pages. That alone gave shoppers back the 56% of taps they were wasting. I go deeper on this in how popups quietly kill conversions.
- Built a condition-grading system. Used furniture lives or dies on trust, so each item got an Excellent, Very Good, or Good badge driven by Shopify metafields, modeled on how 1stDibs sells used luxury goods. It sets expectations before the shopper has to guess, the same fit and condition problem I cover in the fix order for Shopify furniture stores.
- Added a real savings badge. Instead of a generic Sale label on every product, I calculated the actual discount, so a shopper sees minus 42% and can spot the real deals. A generic Sale label on everything means nothing.
- Added a sticky add-to-cart bar. On mobile, once the main button scrolled away, a bar slid in so the action was always one tap away. The technique is documented here.
- Rebuilt the product page around trust. Condition, photos, and buy actions came first; the friction came out.
What the results actually were
Measured over the first 30 days against the prior period: add-to-cart +41%, checkout completion +40%, total sales +51%. The full breakdown, with the audit findings and the Clarity data, is in the Mobelglede case study. I put the numbers on the record because conversion leaks are dollars, and vague “we improved things” claims are worth nothing to a store owner.
Download the CRO Diagnosis Checklist (PDF)
Is a +51% lift realistic for your store?
Here is the honest part, because it is the part most agencies skip. That +51% came from a broken 0.11% baseline with enormous headroom. A store already performing near the Shopify average will not see 51%. Realistically:
- A healthy store should target a 10 to 20% relative conversion improvement from a sprint. That is the credible number.
- A 30 to 50% lift is possible, but only when the starting point is genuinely broken, and no honest consultant guarantees it.
- Anyone who guarantees a specific conversion rate, or sells you a Lighthouse score as a conversion outcome, is selling the wrong thing. I made the same point about hiring a speed service: a lab number is not a business result.
The size of your win is set by how much is broken, not by how good the consultant’s slides are.
How do I know if I have that headroom?
Check three numbers against the benchmarks. Add-to-cart around 4.6% is average, and above 8% is strong. Conversion around 1.4% is average for Shopify. And cart abandonment sits near 70% across ecommerce, so the checkout is almost always leaking too.
If your add-to-cart rate is under 3% or your conversion is under 1%, you are not average, you are broken, and that is good news, because broken is where the big lifts live. If you are already above those numbers, your remaining upside is smaller and more surgical, usually in the checkout. Either way, the audit tells you which one you are before anyone touches the theme.
The takeaway
- Read behavioral data before writing code. On this store, 56% of mobile taps were wasted on popups, and no best-practices checklist would have found that.
- Friction beats features. The biggest wins came from removing overlays, not adding a redesign.
- The numbers: +41% add-to-cart, +40% checkout, +51% sales, over 30 days, from a 0.11% baseline.
- Big lifts need broken baselines. A healthy store targets 10 to 20%, not 51%. Guarantees are a red flag.
- Benchmark yourself first. Under 4.6% add-to-cart or 1.4% conversion means you have real headroom.
I run these data-first CRO sprints on measured behavioral data, and I put the real numbers on the record. If you want to know exactly where your store is leaking and what the realistic upside is, my 30-minute diagnostic call is free.