

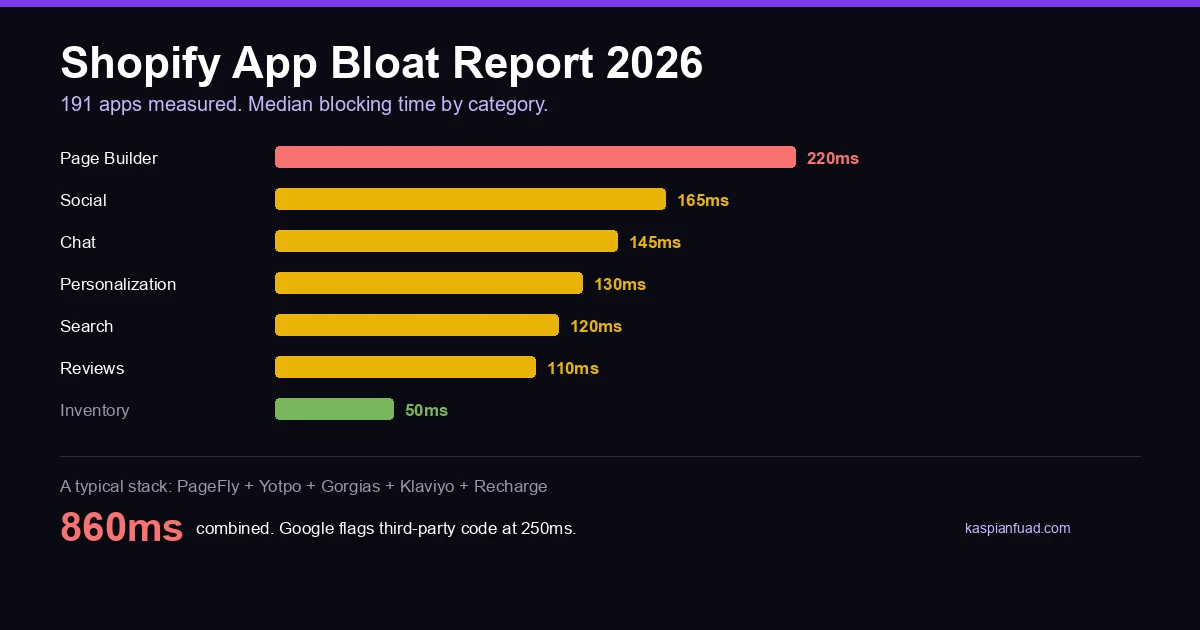
Five apps is a modest Shopify stack. A page builder, reviews, chat, email, subscriptions. I measured what that costs: 860ms of main-thread blocking time. Google flags third-party code at 250ms.
TL;DR: I measured the blocking time of 191 Shopify apps across 18 categories. The median app costs 90ms. Page builders are the worst category at a 220ms median. Analytics, the category everyone blames, is among the lightest at 65ms. Only 13 apps exceed 180ms, so find those first.
Download the App Bloat Report 2026 (PDF)
Every store I audit arrives with the same complaint. Mobile conversion is soft, or Core Web Vitals will not go green, and nobody can say why. Then I open the app stack and find eleven apps fighting over one thread.
This stays invisible because no app tells you what it costs you. The listing shows a price and a star rating. It does not show that the review widget you installed for social proof spends a quarter of a second blocking every tap.
So I measured them. All 191.
Which Shopify apps slow down your store the most?
Page builders, and it is not close. They post a 220ms median, more than double the 90ms median across every app I measured.
| Category | Apps measured | Median blocking time |
|---|---|---|
| Page Builder | 7 | 220ms |
| Social | 6 | 165ms |
| Chat | 14 | 145ms |
| Personalization | 7 | 130ms |
| Search | 9 | 120ms |
| Reviews | 11 | 110ms |
| Email & SMS | 20 | 105ms |
| Cart & Upsell | 15 | 90ms |
| Analytics | 32 | 65ms |
| Subscriptions | 10 | 60ms |
| Logistics | 10 | 52ms |
Page builders are heavy for a structural reason. They ship a rendering runtime to the browser to do a job Liquid already does on the server for nothing. Shogun Page Builder is the heaviest app in the library at 320ms, PageFly at 280ms, GemPages at 240ms. I broke that trade down in PageFly vs Shogun vs GemPages.
Reviews looks mild at a 110ms median until you see the spread. Yotpo costs 250ms while Judge.me does the same job for a fraction of it, which is most of the argument in Judge.me vs Loox vs Okendo vs Yotpo.
Why your analytics stack is probably not the problem
Here is the finding that surprised me most, and it contradicts most speed advice you will read.
Analytics is the biggest category I measured and one of the lightest. Thirty-two apps, a 65ms median. Meta Pixel, TikTok Pixel, Snap Pixel and most of the rest fire asynchronously and do almost no main-thread work. The pixel is not your problem.
Two real exceptions survive. A Google Tag Manager container is only as light as what you put in it, and merchants routinely hide a dozen tags behind one innocuous script. Session recorders are genuinely expensive, with FullStory at 200ms.
The instinct to blame tracking is misplaced. Founders reach for the pixel because it is the thing they feel guilty about. The page builder rendering the homepage is three times heavier and nobody suspects it.
What does blocking time actually mean?
Blocking time is how long an app’s JavaScript occupies the main thread: the single thread that also has to answer a tap. While it is busy, the page looks finished but does not react.
Google counts the main thread as blocked during any long task, which it defines as one running past 50ms. The Total Blocking Time guidance asks for under 200ms on average mobile hardware across the whole page, and Google notes that a low TBT usually means a low Interaction to Next Paint, the responsiveness metric that replaced FID in March 2024.
The number that matters most here is narrower. Lighthouse has a threshold for third-party code specifically: it flags any page whose third-party scripts block the main thread for 250ms or longer. Apps are third-party code. That 250ms is your app budget, and it is the entire budget, shared.
One honest caveat, because this is where speed reporting usually cheats. My per-app numbers are typical contributions, not a lab measurement of your store. The real figure moves with your theme, the app’s configuration, the device and the network.
What does a normal app stack actually cost?
Take a stack I see constantly. Nothing exotic, nothing anyone would call bloated:
| App | Job | Blocking time |
|---|---|---|
| PageFly | Page builder | 280ms |
| Yotpo Reviews | Reviews | 250ms |
| Gorgias | Chat | 150ms |
| Klaviyo | Email and SMS | 120ms |
| Recharge | Subscriptions | 60ms |
| Total | 860ms |
Five apps. 860ms, roughly three and a half times the 250ms at which Google starts flagging third-party code, before the theme renders a single product image.
Nobody chose this. It accumulated. Each app was a reasonable decision made in a different month by a different person, and not one of those decisions had a millisecond attached to it. Shopify’s own partner blog notes the number of apps the average merchant runs has grown six fold since 2012.
Speed is worth this attention because it is worth money. The Deloitte study Google published, Milliseconds Make Millions, tracked 37 brands over 30 million sessions and found a 0.1 second improvement lifted retail conversions 8.4% and average order value 9.2%. Read the method before you quote it: that 0.1s was the cumulative effect of four speed metrics together, not one.
Which apps are the worst offenders?
Only 13 of 191 apps cross 180ms. That is 7%, and it is where your audit starts.
| App | Category | Blocking time |
|---|---|---|
| Shogun Page Builder | Page Builder | 320ms |
| PageFly | Page Builder | 280ms |
| Yotpo Reviews | Reviews | 250ms |
| GemPages | Page Builder | 240ms |
| Vitals 40+ Apps | Personalization | 240ms |
| Bambuser Live Shopping | Social | 220ms |
| EComposer | Page Builder | 220ms |
| Intercom | Chat | 220ms |
| Zipify Pages | Page Builder | 220ms |
| Dynamic Yield | Personalization | 200ms |
| FullStory | Analytics | 200ms |
| Teelaunch POD | Inventory | 200ms |
| Yottaa | Performance Proxy | 200ms |
Five of the thirteen are page builders. That one category is the highest-yield thing to look at on most stores.
The last row is the sharpest finding in the dataset. Yottaa sells web performance, advertising that it will accelerate page loads by up to 30% partly by sequencing third-party scripts, and it costs 200ms itself. That is not hypocrisy and I am not calling it that: a proxy that defers enough other scripts can come out ahead. It is a trade, not a free upgrade, and it belongs in the same budget as everything else you install.
Suites are the quieter trap. Vitals bundles 40+ modules into one app at 240ms, and every module you switch on adds its own work, so the total climbs without anyone installing anything new.
Does Shopify limit how much an app can slow your store?
Loosely, and the limit is per app. Shopify requires that an app must not reduce storefront Lighthouse performance scores by more than 10 points to be published in the App Store, and applies the same ten-point ceiling to Built for Shopify status.
Read that again, because it explains your store. The cap is individual. Ten apps each sitting politely inside a ten-point limit still add up to a store that fails, and nothing in the App Store measures the total. Shopify says as much in its own help docs: too many apps loading assets on your storefront can slow performance.
The Built for Shopify badge is worth reading carefully too. Its headline Web Vitals requirements, LCP under 2.5s, CLS under 0.1, INP under 200ms, measure the app’s performance in the Shopify admin. That is the back office you log into, not the storefront your customer taps. A badge that looks like a promise about your PDP is largely a promise about the app’s own dashboard.
The platform is not lying to you. It just never adds up the bill.
How do I audit my own app stack?
Ten minutes, three steps, no signup:
- Scan your storefront with the App Bloat Detector. It reads your page for the script signatures of all 191 apps and tells you what you actually have, which is rarely what you think you have.
- Rank what it finds against the App Speed Index, the full dataset behind this report, sortable by blocking time, category and price.
- Check real users with the CruxGrader. It reads your Chrome UX Report field data, which is what Google actually ranks on. Lab numbers argue; field data decides.
Then cut in the order the data gives you, not the order that feels productive.
Should you uninstall a heavy app?
No. Not on the millisecond figure alone, and this is where most speed advice goes wrong.
An app that earns more than it costs is worth its blocking time. A 120ms email app driving a fifth of your revenue is a good trade. A 250ms review widget doing a job a 40ms one does equally well is not. The question is never whether an app is heavy. It is whether it is heavy for what it does.
Shopify puts the same test more politely, telling merchants to evaluate installed apps and third-party code to ensure they create enough value to offset any potential performance losses. That is the whole job in one sentence. The only thing missing was the number on the other side of the trade.
That is what this report is. Sort by blocking time, then judge every row on what it earns.
The takeaway
- Measure blocking time, not page weight. Weight is the number app marketing quotes because it flatters them.
- Start with page builders. A 220ms median, five of the heaviest thirteen apps, and native Liquid sections cost 0ms.
- Stop blaming your pixels. Analytics is the biggest category and among the lightest at 65ms.
- Budget the whole stack. Google flags third-party code at 250ms total, and Shopify only caps apps one at a time.
- Keep every app that earns more than it costs. Cut the rest.
I am Kaspian Fuad, a Shopify CRO consultant. The full dataset behind this report is public at the App Speed Index, because the app listings will never show you this number.