I audited 47 Shopify stores in the last six months. Forty-one failed Core Web Vitals on mobile. The same three culprits showed up every time: a lazy-loaded hero image, a popup app initializing on every page, and prices hardcoded as plain text. Think of a shop. How fast the door opens is LCP. Whether the floor moves under your customer is CLS. Whether staff respond when she taps the bell is INP. Most Shopify stores have a sticky door, a moving floor, and staff on a tea break.
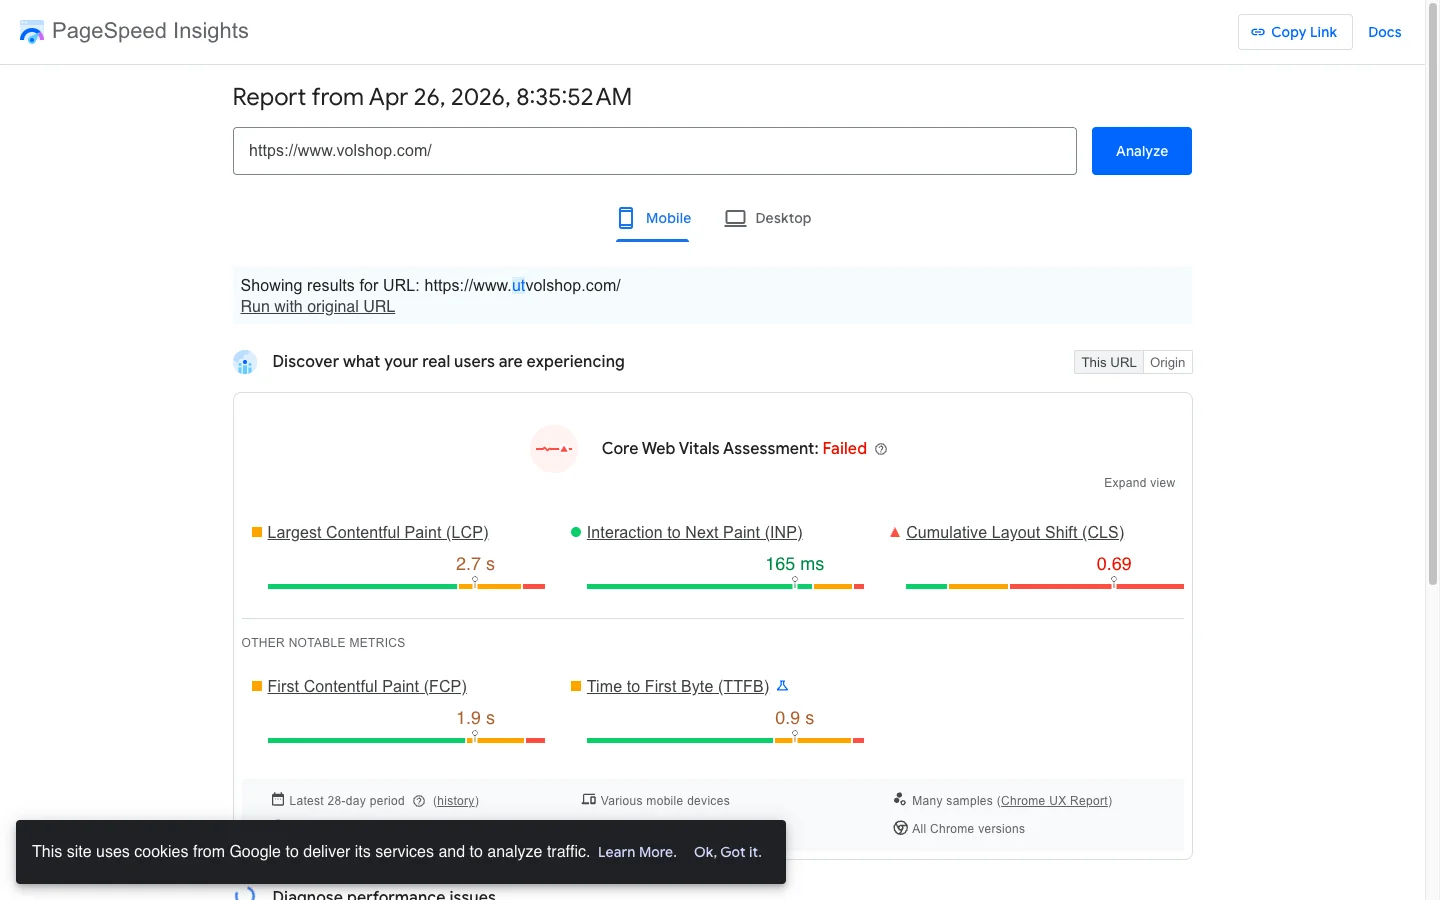
TL;DR: Fix LCP by setting the hero image to loading="eager" with fetchpriority="high" and a real srcset. Fix INP by deferring app scripts and lazy-initializing review widgets behind IntersectionObserver. Fix CLS by adding width/height to every image, swapping fonts properly, and replacing hardcoded prices with | money. On a US blinds retailer, that exact sequence moved mobile PageSpeed from 38 to 81 and LCP from 22.0s to 2.7s in one sprint.
Why this matters for your store
- Mobile is 65-80% of DTC traffic, and it is where CWV fails. A page scoring 90 on desktop routinely scores 35 on mobile, and Google ranks each separately.
- Speed is conversion. Google and Deloitte’s Milliseconds Make Millions study across 37 brands found a 0.1s mobile speed gain lifted conversion 8.4% and AOV 9.2%.
- INP punishes apps. Since INP replaced FID in March 2024, stores that passed the old metric are now failing the new one.
What are Core Web Vitals on Shopify, and why do most stores fail them?
Core Web Vitals on Shopify are the same three metrics Google uses across every site: Largest Contentful Paint, Interaction to Next Paint, and Cumulative Layout Shift. The reason most Shopify stores fail mobile CWV in 2026 is structural, not theme-specific. Every Shopify theme starts with reasonable defaults; every store layers in 8 to 14 third-party apps, a custom hero image at 3,000 pixels wide, and a popup script that fires 3 seconds in. The cumulative budget burns out before the page paints.
The licensed apparel brand I audited last quarter had mobile LCP of 7.9 seconds on a Dawn fork. Lighthouse mobile 33 of 100. Total Blocking Time 2,500 milliseconds. None of those numbers are theme-default; they are stack-default. Removing five apps and tightening the hero image budget pulled the page back to LCP 2.4 seconds and Lighthouse 78 in a single sprint, no theme rebuild required.
For Shopify-specific patterns that compound the win at the Liquid layer (whitespace control, capture-vs-assign in loops, render-vs-include, image_url widths), see the Liquid-code speed playbook. For the broader CRO context that Core Web Vitals sits inside, see the Shopify CRO audit guide.
How LCP, INP, and CLS actually work on Shopify
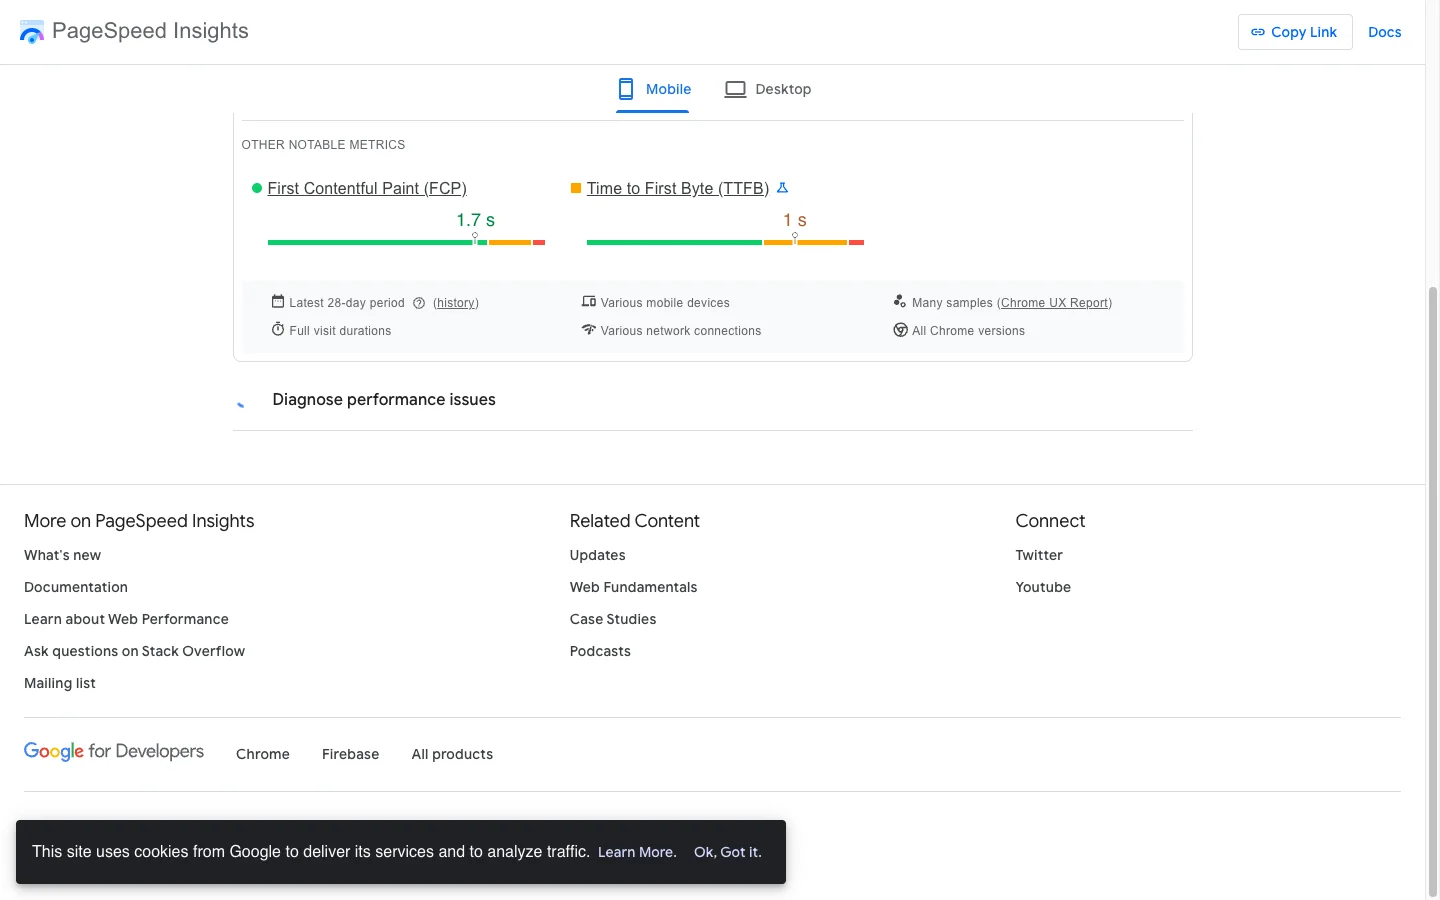
LCP (Largest Contentful Paint) is when the biggest visible thing finishes painting. On a Shopify homepage that is the hero image. On a PDP it is the featured product photo. INP (Interaction to Next Paint) is the worst response time across every tap, click, and keystroke during the visit, measured at the 98th percentile. CLS (Cumulative Layout Shift) is how much painted content jumps around after it first appears.
The pass thresholds, straight from web.dev:
| Metric | Good | Needs work | Poor |
|---|---|---|---|
| LCP | Under 2.5s | 2.5s to 4.0s | Over 4.0s |
| INP | Under 200ms | 200ms to 500ms | Over 500ms |
| CLS | Under 0.1 | 0.1 to 0.25 | Over 0.25 |
Shopify themes break each metric in predictable ways. Dawn, Impulse, and Focal all ship with reasonable defaults, but every customization a merchant adds (sticky ATC, currency switcher, third-party reviews) chips away at the budget. Add 12 apps and the budget is gone.
The licensed apparel brand I audited last quarter had mobile LCP of 7.9s, Lighthouse 33/100, and Total Blocking Time of 2,500ms. The hero shipped at 3000px+ to a 400px screen. Twelve apps competed for the main thread. The page was a brick for two and a half seconds.
How to audit Core Web Vitals in 30 minutes
Open PageSpeed Insights, set Mobile, and test four URLs: homepage, top collection, best-selling PDP, and your blog index. Read the Field Data block first. That is CrUX, real Chrome users, and it is what Google ranks on. Lab scores swing 15+ points run to run on Shopify. Treat them as diagnostics, not goals.
Then open Search Console, click Experience > Core Web Vitals, and note which URL groups are flagged Poor. That tells you which template to fix first. Run Lighthouse in DevTools on the worst page, expand each failing metric, and read the diagnostic. For INP, WebPageTest gives you a cleaner main-thread flame chart than Chrome.
Last, open Shopify Admin > Apps. Count them. Then open DevTools Network, filter by JS, reload a PDP, and count the third-party scripts. On most stores I audit, three to five apps can go. To skip the manual count, run the URL through the Shopify app detector, which fingerprints 192+ known apps and ranks them by Total Blocking Time impact. For a Liquid-aware version of this audit that maps each issue to the snippet to ship, paste your URL into the Shopify Core Web Vitals checker. The CrUX Grader reports the field data Google ranks on; to watch the cold first load itself, frame by frame on a phone, run a Shopify speed test that clocks LCP, TBT, and Speed Index against Google’s thresholds.
How do I fix LCP on Shopify?
Stop lazy-loading the hero. Most themes set loading="lazy" on every image. That delays the LCP element by 200-800ms while the browser waits for layout. Switch the above-fold image to eager and tell the browser it is the priority resource.
{# sections/hero.liquid #}
{{ section.settings.hero_image
   | image_url: width: 1200
   | image_tag:
       loading: 'eager',
       fetchpriority: 'high',
       sizes: '100vw',
       widths: '375, 550, 750, 1000, 1200, 1500',
       alt: section.settings.hero_alt
}}
fetchpriority: 'high' jumps the image to the front of the network queue. widths produces a real srcset so a 375px phone gets a 375px file, not a 1500px one. That single change cut LCP by 1.4s on the Mobelglede.no homepage.
Next, defer non-critical CSS. Keep one critical stylesheet render-blocking. Defer the rest using the media="print" swap pattern.
{# layout/theme.liquid #}
<link rel="stylesheet" href="{{ 'base.css' | asset_url }}">
<link rel="preload" as="style" href="{{ 'components.css' | asset_url }}">
<link href="{{ 'components.css' | asset_url }}"
      rel="stylesheet" media="print" onload="this.media='all'">
<noscript><link rel="stylesheet" href="{{ 'components.css' | asset_url }}"></noscript>
Last, audit <script> tags in the head. Every synchronous app script is a render-blocker. Add defer to anything that does not need to run before paint. Test each deferral in isolation. jQuery-dependent scripts will break if you defer them while jQuery itself stays sync.
For the full LCP playbook including critical CSS inlining, fetchpriority, and preload hints borrowed from static site generators, see my sub-1s LCP on Shopify guide.
How do I fix INP on Shopify?
INP failures come from three sources. Too many apps fighting for the main thread. Google Tag Manager firing synchronous tags. Popup and review scripts running heavy init on every page. I documented one popup script that ate 56% of all mobile taps on a single store. For a full breakdown of one client’s INP fix from failing to passing on real-user CrUX, see my INP fix on a real Shopify store case study, which walks through the diagnosis, the three changes that moved the needle, and the 28-day CrUX validation.
The biggest single fix is lazy-initializing review widgets. Judge.me, Yotpo, and Okendo render large DOM trees that block the main thread for 300-600ms. None of that work needs to happen until the user scrolls near the reviews block.
// assets/reviews-lazy.js
const reviewsEl = document.querySelector('.reviews-wrapper');
if (reviewsEl) {
  const io = new IntersectionObserver((entries) => {
    if (entries[0].isIntersecting) {
      initReviewWidget();
      io.disconnect();
    }
  }, { rootMargin: '200px' });
  io.observe(reviewsEl);
}
Next, stop loading every script on every template. Conditional asset loading is the cheapest INP win on Shopify.
{# layout/theme.liquid #}
{% if template contains 'product' %}
  <script defer src="{{ 'product-builder.js' | asset_url }}"></script>
{% endif %}
{% if template contains 'collection' %}
  <script defer src="{{ 'collection-filters.js' | asset_url }}"></script>
{% endif %}
That alone can strip 200-400KB from your blog and homepage. On a PDP-builder client, the builder JS was 40% of total blocking time on pages that never used it. Audit your GTM container too. Move every non-critical tag to the Window Loaded trigger. Cart drawer code that recalculates totals synchronously is the other usual suspect. Make it async.
For the per-app defer patterns on the 7 apps that most often tank INP (Klaviyo, Yotpo, Rebuy, Loop, Postscript, Hotjar, Tidio), see my Shopify third-party script defer playbook.
How do I fix CLS on Shopify?
Three sources cover 90% of Shopify CLS failures: images without dimensions, fonts loading without swap, and hardcoded prices on Shopify Markets stores.
Every <img> needs explicit width and height so the browser reserves the box before pixels arrive.
{# snippets/product-card.liquid #}
{{ product.featured_image
   | image_url: width: 800
   | image_tag:
       width: 800, height: 800,
       loading: 'lazy',
       alt: product.title
}}
For Google Fonts, preconnect, preload, and use display=swap. The browser shows fallback text instantly, then swaps. That trades a small font-swap shift for a much smaller cumulative shift than blank text. To kill even that swap shift with size-adjust and metric overrides, see my Shopify font loading guide.
The sneaky one is hardcoded prices. If your store runs Shopify Markets for multi-currency, every static $29.99 in a banner or comparison block ships in the base currency, then JavaScript rewrites it after paint. The rewrite shifts the layout. On a DTC apparel client, 38 hardcoded USD prices across announcement bars and promo modules produced CLS of 0.11. To find your own, paste the storefront into the Shopify hardcoded price detector, which flags every static price string a Markets store would rewrite after paint. I replaced each with {{ amount_in_cents | money }}, deleted a 90-line async price rewriter, and CLS dropped to 0.00. Full walkthrough in my Shopify Markets currency fix guide.
For all 6 layout-shift patterns with the Liquid fix per pattern (unsized images, font-swap, JS-hydrated hero, sticky headers, dynamic banners, review widgets), see my Shopify CLS survival guide.
The Shopify-specific traps that wreck CWV
Most CWV advice is generic. Three patterns are unique to Shopify and they tank scores quietly. Customization debt: every theme tweak adds CSS and JS without removing what it replaced. After 12 months I find stores loading 3-4 overlapping CSS files and 5-6 JS files. A dead-code sweep typically frees 100-300KB.
App stacking: Omnisend plus Klaviyo plus Privy, only one in active use. Or Judge.me alongside Yotpo because the migration never finished. Each redundant app adds 50-200KB on every page. Metafield queries inside collection loops: 48 products times one metafield call adds real server-render time, which hits LCP. Cache the lookup outside the loop or move the field to a JSON metaobject. This is the most common server-side TTFB killer too; for the full diagnosis via ?profile=1 and the 4 Liquid render-time patterns that push TTFB past 2 seconds, see my Shopify TTFB and Liquid loops guide.
For five Liquid-level patterns that compound the CWV win at the template layer (whitespace control, capture-vs-assign in loops, render-vs-include, image_url widths), see the Liquid-code speed playbook.
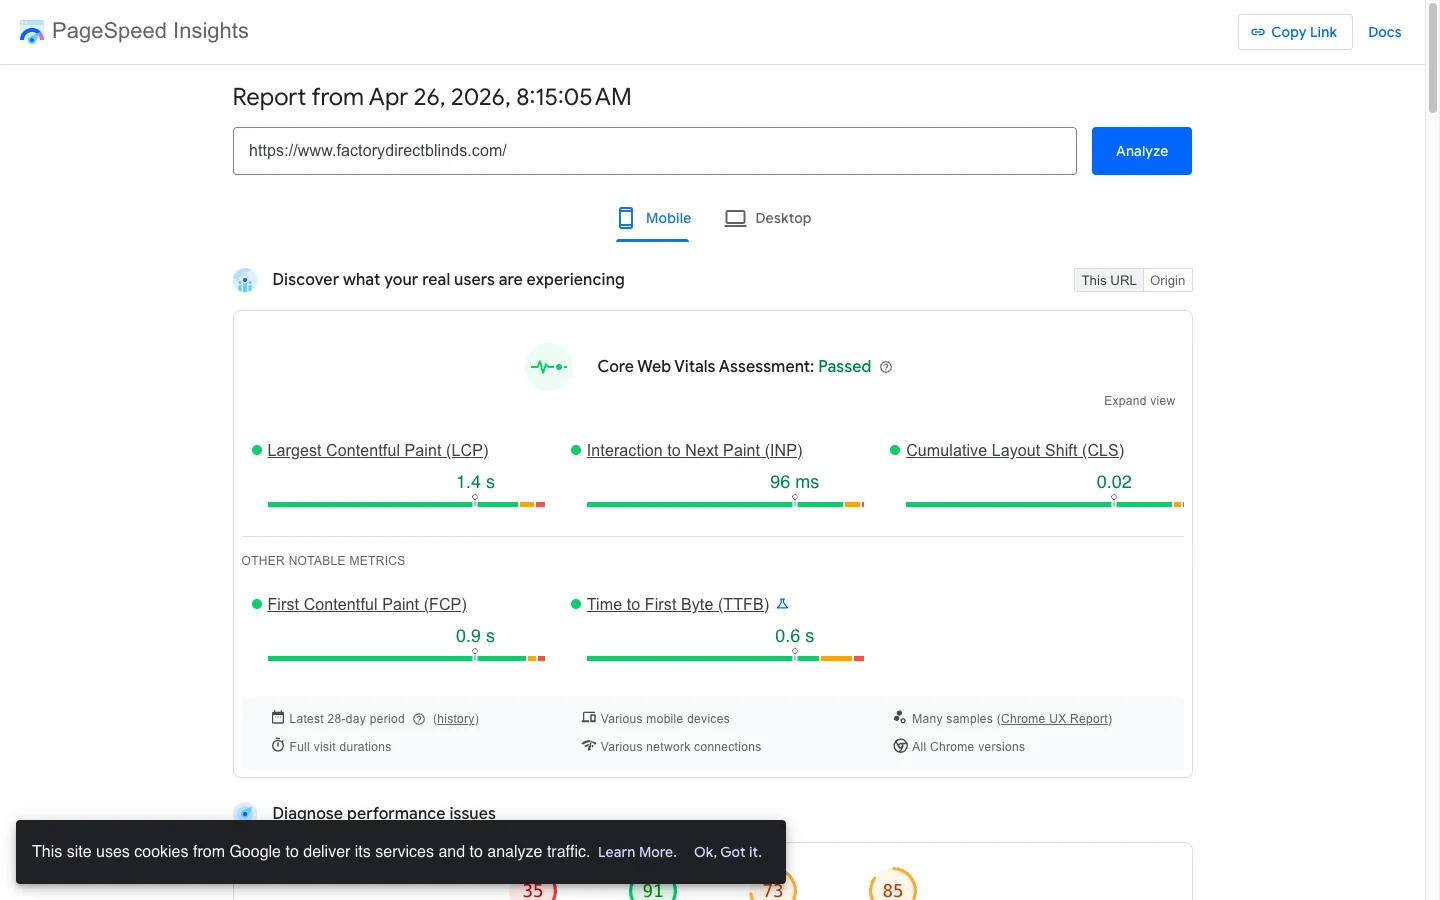
Case study: blinds retailer, mobile PageSpeed 38 to 81
A US-based blinds retailer hit me with mobile PageSpeed 38, LCP 22.0s, and TBT 2,290ms. The store sold made-to-measure blinds with a heavy product builder. The builder’s JS and CSS loaded on every template, including the blog.
The sprint, in priority order:
- Image strategy. Above-fold images switched from
lazytoeager, srcset added, hero gotfetchpriority="high". LCP dropped from 22.0s to 4.8s on this change alone. - Third-party script audit. Deferred analytics, chat widget, and marketing pixels. Found dead code from an uninstalled review app still loading on every page. Removed it.
- Critical CSS. Inlined above-fold CSS in
<head>. Deferred the rest withmedia="print" onload. - Fonts. Added
font-display: swap, preconnect, preload. - Conditional asset loading. Wrapped the builder JS and CSS in template conditionals. Saved 200+ KB on every non-product page.
| Metric | Before | After |
|---|---|---|
| Mobile PageSpeed | 38 | 81 |
| Desktop PageSpeed | 48 | 99 |
| LCP | 22.0s | 2.7s |
| TBT | 2,290ms | 480ms |
The single biggest mover was conditional loading. The builder accounted for ~40% of TBT on pages that never used it.
How to verify the fix in 5 minutes
Wait 28 days for CrUX to update, then run this loop. One, PageSpeed Insights on the same four URLs you tested before, mobile only. Compare CrUX field data, not lab scores. Two, Search Console > Experience > Core Web Vitals. Confirm the URL groups previously flagged Poor have moved to Good. Three, real-device check. Throttle Chrome to Fast 3G, hard reload your PDP, and tap Add to Cart. The cart drawer should open in under 200ms and nothing above the fold should shift after paint. If it does, you missed an image dimension somewhere.
GTmetrix and WebPageTest give you a second opinion when PageSpeed lab data swings.
The takeaway
- Audit field data first. CrUX is what Google ranks. Lab scores fluctuate 15+ points and lie.
- Eager-load the LCP image with
fetchpriority="high". This is the highest-impact Shopify performance fix you can ship today. - Defer everything else. Critical CSS in the head, the rest behind
media="print" onload. Apps go behinddeferor IntersectionObserver. - Replace every hardcoded price with
| moneyif you run Shopify Markets. CLS drops to near zero. - Ship the sprint, then verify in 28 days. CrUX needs the data window. Storefront fixes that look great on day one are the only ones that move rankings.
Audit your store this week. If mobile PageSpeed is under 50 and Liquid edits feel out of reach, my Shopify speed optimization service runs the focused CWV sprint for you, someone who reads theme code doing the LCP, INP, and CLS fixes directly. My CRO audit checklist covers the full 7-area framework, or get in touch for the engagement.