

TL;DR: High traffic with low conversion is almost never a traffic problem, it is a store problem you can find in one afternoon. High-traffic stores that do not sell fail on one of three fronts: traffic quality, technical friction, or offer and page friction. Build a GA4 funnel, read the largest single drop, and confirm it in a Microsoft Clarity heatmap before you touch the theme. On one store I ran, that process found 56% of mobile taps were wasted closing popups. Fixing it drove +51% sales on flat traffic.
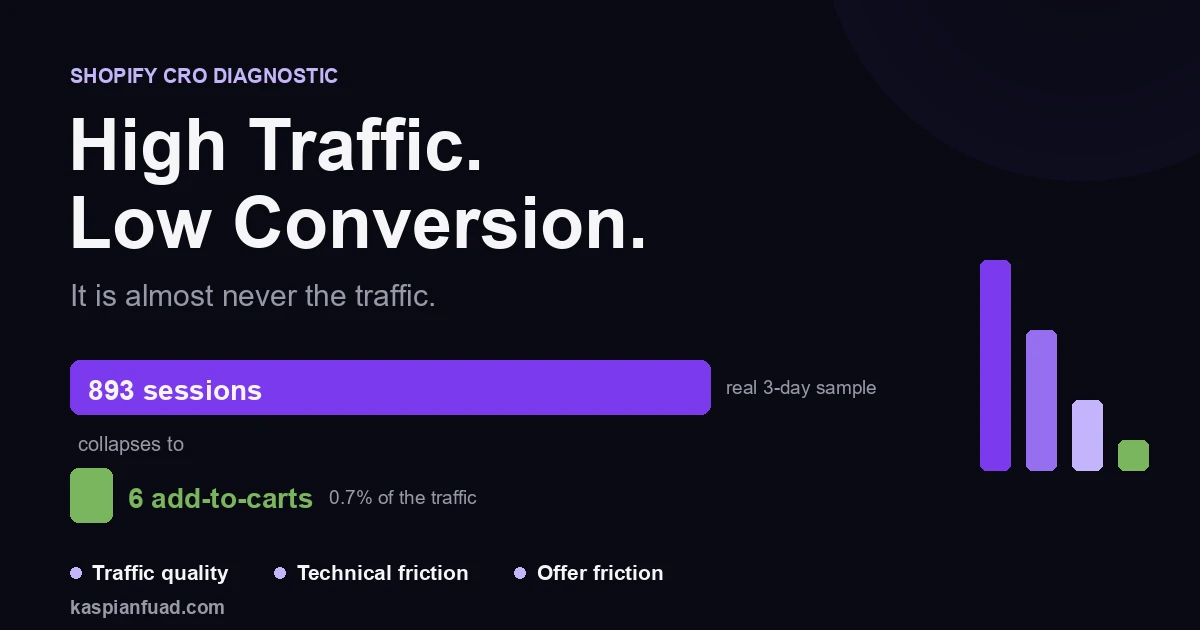
A store owner messages me some version of the same thing every few weeks. “I’m getting the traffic. Meta is spending, Google is spending, the sessions are there, and almost nobody buys.” Then they ask if the homepage needs a redesign. It almost never does. In a 3-day sample from one store, 893 real sessions produced 6 add-to-carts. Six. The traffic was fine. Everything the traffic hit was broken.
Why does my Shopify store get traffic but no sales?
Because “low conversion” is one symptom with three very different causes, and blind advice treats them as one. A high-traffic store that does not convert is failing on at least one of these: the traffic is unqualified, the store is technically broken, or the product page and offer do not close the sale.
The single worst first move is to assume the homepage is the problem and redesign it. Most sessions on a paid-traffic store land on a product page, not the homepage, so a homepage rebuild polishes a room nobody walks into. Find the cause, then fix the cause. My 5 conversion leaks framework scores each candidate leak on traffic, gap, and effort so you fix the one bleeding the most dollars first, not the one that is easiest to see.
So the job is a diagnosis, in this order: is the traffic real, is the store fast, and does the page sell. Work it top to bottom and the answer usually falls out by the second step.
Is it the traffic or the store?
Segment before you spend another dollar on ads. In GA4, break conversion rate down by source/medium and by device, then read two patterns. If one channel converts far below the rest, you have a traffic-quality problem in that channel. If every channel drops at the same step, you have a store problem that no targeting change will fix.
On the furniture store I keep pointing to, 75% of traffic was mobile and 56% of sessions arrived through Meta’s in-app browser, which mangles cookies and rendering. Pouring more budget in would have sent more people into the same broken funnel at the same 0.11% rate. The full teardown of that store is in how a Shopify store went from 0.11% to +51% sales.
Fast traffic-quality tells: a campaign whose sessions bounce at near-zero duration, a country you do not ship to eating impressions, or a traffic spike with no branded search behind it. Those are not conversion bugs, they are targeting bugs, and CRO will not fix them.
How do I find where shoppers actually drop off?
Build the funnel, then watch real sessions. The GA4 ecommerce funnel has six steps: session_start, view_item, add_to_cart, begin_checkout, add_payment_info, and purchase. The largest single drop in user count between two steps is your primary leak. That one number tells you whether to work on the product page, the cart, or the checkout, and it stops you optimizing a step that was already fine.
Numbers tell you where. Recordings tell you why. Install Microsoft Clarity (it is free) and read the mobile click and scroll heatmaps for the leaking step. On that store, the click heatmap showed 56% of all mobile taps went to dismissing a full-screen cookie modal and an email popup, and 21% of visitors left before they ever reached the add-to-cart button. You cannot buy a sofa while you are fighting a popup. No best-practices checklist would have surfaced that. The data directed the entire sprint, and I go deeper on it in how popups quietly kill conversions.
Does mobile speed really cause low conversion?
Yes, and it lands hardest on mobile. Shopify itself names apps, third-party scripts, and oversized images as the biggest performance drags, and warns that checkout extensions add JavaScript execution that is most noticeable on phones. Two field metrics matter: LCP, how fast the main content paints, and CLS, how much the page jumps while loading. A layout that shifts under a shopper’s thumb sends the tap to the wrong element and reads as a broken store.
On one store on flat traffic, cutting cart CLS from 0.488 to 0.001 helped reached-checkout rise 30%. The heaviest drag is almost always the app stack, not the theme, which is why I measured the blocking time of nearly 200 Shopify apps rather than guess. Work through the mobile CRO guide before you pay for a redesign.
Here is where most CRO advice gets it backwards: it starts at the theme. The theme is the last place I look. The furniture store’s +51% sales lift, and roughly $38,000 of incremental gross sales in a two-week window on another store, came from removing friction the owner could not see, not from a new design. A broken baseline is good news. Broken has headroom.
Where high-traffic stores quietly lose the sale
Once the traffic is real and the store is fast, the sale is won or lost on the product page. Three things close it: trust, a clear offer, and a button always in reach.
Trust is specific, not decorative: real reviews near the price, a plain returns line, and a photo set that answers the objection instead of repeating the hero shot. The offer has to be legible in a glance. A generic “Sale” label on every product means nothing, so I calculate the real discount and show “minus 42%” so a shopper can spot the deal. And on mobile, a sticky add-to-cart bar keeps the action one tap away after the main button scrolls off screen.
The cart and checkout leak too. Cart abandonment sits near 70% across ecommerce per Baymard, so even a clean product page loses ground at the last step. If your funnel’s biggest drop is at begin_checkout, that is where the money is, and I cover it in reducing checkout abandonment.
Download the High-Traffic, Low-Conversion Triage checklist (PDF)
When should I fix it myself versus hire someone?
Check three numbers against the benchmarks first. Add-to-cart around 4.6% is average and above 8% is strong; conversion around 1.4% is the Shopify average. If your add-to-cart is under 3% or conversion is under 1%, you are not average, you are broken, and broken is where the big lifts live.
Do it yourself when the leak is obvious once you look: a popup eating taps, a slow app, a missing sticky button. The CRO audit checklist walks the whole funnel. Hire out when you have traffic and still cannot find the leak, or when finding it is not the same as having time to ship a fix every week. A one-off audit finds the leaks; a CRO retainer fixes them and compounds the wins across checkout, speed, and search. Whoever you talk to, make them show measured before-and-after numbers from a store they actually shipped, and treat any guaranteed conversion rate as a red flag.
The takeaway
- Diagnose before you redesign. Traffic quality, technical friction, or offer friction, in that order. Most homepage redesigns fix none of them.
- Segment by source and device first. One bad channel is a targeting problem; every channel dropping at one step is a store problem.
- Build the GA4 funnel, then watch Clarity. The largest single drop names the leak; the heatmap shows why, like the 56% of taps lost to popups.
- Speed is often the first wall on mobile. Cutting cart CLS from 0.488 to 0.001 moved reached-checkout 30% on flat traffic.
- Benchmark yourself. Under 4.6% add-to-cart or 1.4% conversion means real headroom, and that is where a sprint pays for itself.
I am Kaspian Fuad, a Shopify CRO and performance consultant. I read the behavioral data before I write a line of code, because the leak is almost never where the owner thinks it is. If your traffic is fine and your sales are not, book a call and I will tell you which of the three it is.