

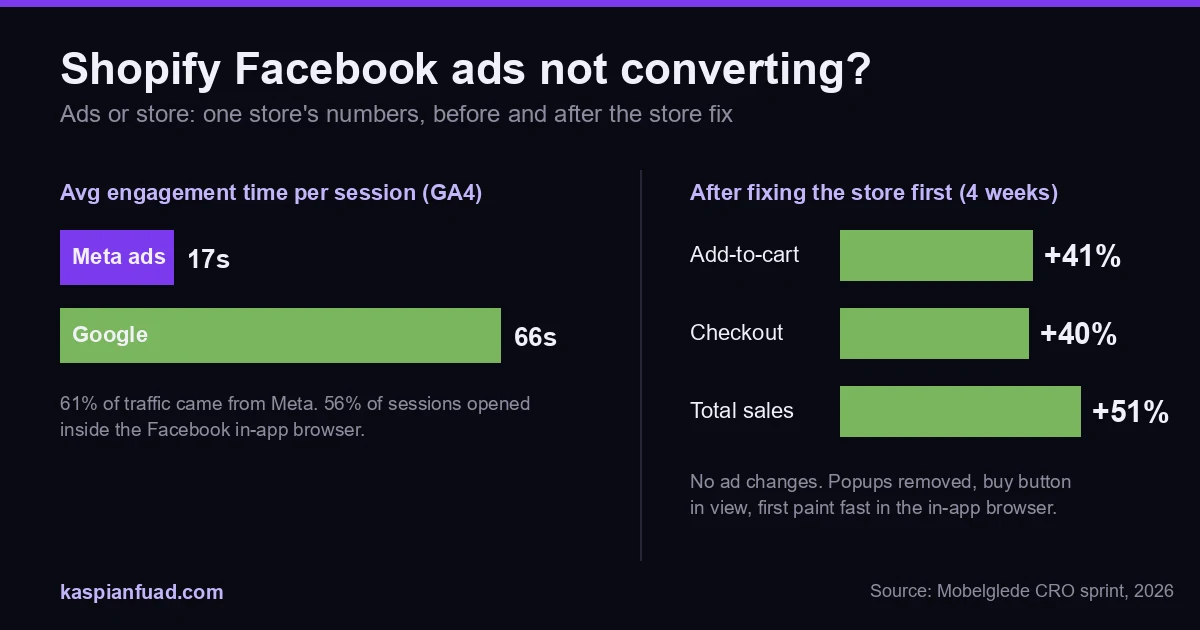
TL;DR: When Shopify Facebook ads get clicks and no sales, one GA4 comparison settles whether the ads or the store is at fault. Line up Meta against Google and direct on engagement time, add-to-cart and purchase rate. On the store below, Meta sessions averaged 17 seconds against 66 seconds for Google. The store was still the first fix, because 56% of mobile taps were going to popups. Fixing the store lifted sales 51%; the campaign became the bottleneck after that. Below is the comparison, the six store faults in order, and who to hire.
Mobelglede, a Norwegian furniture marketplace, was spending on Meta ads, and the traffic showed up. Mobile was 75% of sessions, 56% of all sessions arrived through the Facebook in-app browser, and the mobile conversion rate was 0.11%. In a 3-day sample of 893 real sessions, six people added something to a cart. The owner asked the question every Meta budget eventually asks: is it the ads, or is it the site?
The honest answer was both, in a specific order. The order is the part the ad blogs on page one of Google get wrong. Below is how I separate the two.
Download the Meta Traffic Diagnostic Sheet (PDF)
Why this matters for your store
- Paid social is the most expensive traffic you buy, and every visitor who bounces off a broken landing page also teaches the Meta pixel the wrong lesson about who converts.
- A store converting Meta traffic at 0.5% instead of the 2.66% global average needs five times the ad budget for the same revenue.
- Four of the six store faults below are theme fixes measured in hours, and they compound across every campaign you run afterwards.
Is it the Facebook ads or the Shopify store?
Compare the traffic sources against each other before you blame either. Open the GA4 Traffic acquisition report. It breaks sessions down by source and medium with engagement rate, average engagement time and key events. Put Meta, Google organic, Google paid and direct side by side on four columns: engagement rate, engagement time, add-to-cart rate and purchase rate.
The pattern tells you where to look. If Meta alone has a low engagement rate and a short engagement time, the campaign is sending people who never meant to buy, or the page fails inside Meta’s browser. If every source drops at the same step, say 4% add-to-cart and 0.6% purchase across the board, the store has a fault that hits everyone. The ads are just the traffic you notice.
On Mobelglede the split was stark. Meta drove 61% of traffic with 17 seconds of average engagement. Google referrals had a 72.7% engagement rate and 1 minute 6 seconds of average time, and converted at the highest rate on the site. Another 13.5% of sessions were confirmed bots. That reads like an ad problem, and it partly was. But the store faults hit the Google visitors too, and they were cheaper to fix, so they went first.
Then run the same split by device inside Shopify. The conversion rate and added to cart rate fields are sessions with the action divided by all sessions, so mobile against desktop needs no GA4 setup. Paid social is almost entirely mobile, so a mobile-only collapse shows up here first.
Why does Meta traffic convert worse than everything else?
Three reasons, and only one of them is the ad creative.
First, the browser. A tap on a Facebook or Instagram ad opens your store inside Meta’s own in-app browser, not Safari or Chrome. Felix Krause documented in August 2022 that “links to external websites are rendered inside the Instagram app, instead of using the built-in Safari.” The app also injects its own JavaScript into every page, ad landing pages included. In my testing on that store, the in-app browser had no service worker support, limited caching and slower script execution. An app-heavy theme that feels fine in Safari feels broken in the ad click. Mobelglede’s Meta sessions averaged 16 seconds before the fix, so the first paint had to show image, title and price inside 1.5 seconds.
Second, the campaign objective. Meta’s own objectives guide describes Traffic as “increase traffic to an online destination of your choice” and Sales as “find people likely to purchase your goods or services.” A Traffic campaign is optimized for the cheapest click Meta can find, and the cheapest click is a scroller. Mobelglede’s Phase 2 audit found the campaign had most likely been running on link clicks, which explains 17 seconds of attention.
Third, the signal. A Sales campaign only works as well as the purchase events it learns from. Meta scores each server event with an event match quality score from 0 to 10. Matched events, in Meta’s words, “help you attribute conversions to your ads and deliver them to people who are more likely to convert.” A store on Shopify’s Standard data-sharing level sends browser events only, and Shopify’s data-sharing help is blunt that “a browser-based ad blocker can prevent the Meta pixel from sharing data.” Enhanced and Maximum add the Conversions API, which sends the purchase event server to server. If the pixel sees half your purchases, Meta optimizes toward half a picture.
What should I check on the store first?
Six faults, in the order I check them. The first four took Mobelglede from 0.11% to a working funnel.
-
The landing page in the in-app browser. Open your own ad on a real phone, tap it, and time the first paint. Not Lighthouse, the actual Instagram browser. If image, title and price are not on screen inside 2 seconds, nothing below matters. The fixes: inline the above-the-fold CSS, defer the app scripts, eager-load the first image only, and cut the app bloat that only Safari forgives.
-
Popups and the cookie modal. Microsoft Clarity showed 56% of all mobile taps on Mobelglede’s product pages went to two overlays. One was a cookie modal covering 60% of the viewport, the other an Omnisend popup with zero signups. A paid visitor with 17 seconds of patience spends them closing things. The popup data is its own post; the fix was a bottom-bar cookie notice and no email popup on product pages.
-
The ad promise against the page. Read the ad, then the first viewport of the landing page, and check three things match: product, price and offer. A 30% off creative landing on a page that hides the discount until checkout is a bounce. A video landing on the homepage instead of the product page adds a click most in-app sessions do not survive. Land on the product page and show the discount where the ad showed it.
-
The buy button and the form. On Mobelglede, 21% of mobile visitors left before the add-to-cart button entered the viewport, and a third were gone by 50% scroll. A sticky add-to-cart bar and a constrained image height moved the button into the first screen. Then test the form on every variant on a real phone with the console open. A page that says Unavailable on one size converts nobody who wanted that size. The product page fix order covers the rest.
-
Price context. Paid social visitors see the price cold, with no brand relationship to soften it. Show shipping or the free shipping threshold next to the price, show installments, and show the trust signals a first-time visitor needs: returns, payment, who you are. Baymard’s abandonment research still puts “extra costs too high” at 40% of the reasons people leave, and the ad visitor is the one most surprised by them.
-
Pixel and Conversions API health. Open Meta Events Manager and read the event match quality on Purchase and AddToCart, then check the data-sharing level in Shopify’s Facebook & Instagram channel. Standard means browser only. If the Purchase count in Events Manager sits well under the orders in Shopify, the campaign is learning from a fraction of your buyers. Fix the signal before you judge the targeting.
What should I check on the ads?
Once the store converts the visitors it already gets, the campaign side is a shorter list, and this is where a media buyer earns their fee. Check the objective first: a Traffic campaign feeding a store that needs purchases is the most common cause I find. Check placements, because Audience Network traffic behaves nothing like Instagram feed traffic and both land in the same GA4 row. Then creative-to-page alignment, frequency, and bot filtering, since 13.5% of Mobelglede’s sessions were bots no landing page would ever convert.
The store fix comes first for one reason. A better campaign sends better buyers into the same page. If 56% of their taps go to a popup, you paid more per visitor to lose them the same way. Fix the page, then spend.
What happened when the store was fixed first?
The 87-commit sprint on Mobelglede did not touch the ads. It removed the overlays, moved the buy button into view, added a trust grid and condition badges, showed shipping costs, and made the first paint fast inside the in-app browser. Four weeks after against four weeks before, add-to-cart rose 41%, checkout 40% and total sales 51%. The full teardown is in the 0.11% to +51% sales case, and the numbers are on the case study page.
Add-to-cart and checkout moved together, so the cart and checkout were never the problem. The visitors who got past the popups converted at the rate they always could. The whole lift came from letting a paid visitor see the product.
Then the data flipped. With the store leaks closed, the GA4 split showed Meta at 61% of traffic and 17 seconds of engagement against Google’s 66 seconds. The campaign became the next bottleneck, and Phase 2 was scoped as an ads audit: objective, audiences, placements, creative-to-page alignment, bots. Had the campaign been rebuilt first, the better buyers would have landed on a page that lost 21% of them before the button appeared.
What conversion rate should Facebook ad traffic get?
Lower than your store average, and here is the range. Shopify’s June 2026 benchmarks from Dynamic Yield put the global average at 2.66%, beauty and personal care at 5.32%, fashion at 2.77%, and home and furniture at 1.29%. The same post cites Contentsquare’s retail split of 3.7% on desktop against 2% on mobile, and paid social is mobile.
So a beauty brand converting Meta traffic under 1% has a fault somewhere in the six checks above. A furniture store at 1% is near the category norm, and the question becomes order value and margin. Upstream, Littledata’s benchmark across 2,800 stores puts the average add-to-cart rate at 4.6%; under 3% on paid product-page traffic means the page is physically stopping people. Baymard’s 70.22% average cart abandonment means the checkout still has to hold them.
Build the GA4 funnel exploration from session to purchase for Meta traffic only, and read the biggest drop between steps. That step is where the money goes, and it is rarely the step the ad account is arguing about.
Who should I hire when Facebook ads are not converting?
A Shopify CRO specialist who can read GA4 and Events Manager and also write theme code. One person who runs the source comparison, ships the popup and buy-button fixes, checks the pixel events, and measures the next four weeks.
The reason is the shape of the problem. Of the six store checks, four are theme code, one is analytics and one is a Meta setting. A media buyer sees the ad account and tells you the site is slow. A general developer makes the site faster and never opens the engagement split. A CRO agency hands you a testing roadmap and a retainer. You need the person who fixes the cookie modal on Tuesday, moves the buy box on Wednesday, confirms the Purchase count on Thursday, and only then says whether the campaign needs a media buyer.
Ask one question before hiring anyone: “Show me a store with paid traffic where you moved the conversion rate, with the source split before and after.” Expect a fixed-scope audit at $500 to $2,500 in 2 to 3 days, and senior fix time at $50 to $75 an hour. My published rates sit at the low end of that, and the agency versus freelancer comparison shows where each pays off. If the Meta budget is over $10,000 a month, a CRO retainer that reads the funnel weekly costs less than one bad month of spend.
How to verify in 5 minutes
Open GA4, Reports, Acquisition, Traffic acquisition, and set 28 days. Read average engagement time and key events for Meta against Google organic. Then open your own ad on your phone, tap it, and count the seconds until you see the price and the things you close before you can scroll. If Meta engagement is under a third of Google’s, or you closed two things before the product appeared, you have found the first fix for free.
The takeaway
- Compare sources before blaming either. Meta against Google on engagement time, add-to-cart and purchase names the fault.
- Fix the store first, because a better campaign into a broken page is a more expensive way to lose the same buyer.
- Test the landing page inside the in-app browser on a real phone; Safari forgives what Meta’s browser does not.
- Kill popups on paid landing pages; on one store they took 56% of mobile taps.
- Check the objective and the Purchase event count before you touch the targeting. A Traffic campaign buys scrollers.
I am Kaspian Fuad, a Shopify developer and CRO consultant. I find where paid visitors stop, fix it in theme code, and measure the funnel by source until the number moves. If your Meta ads get clicks and your store gets no sales, book a call and bring the GA4 traffic acquisition report.