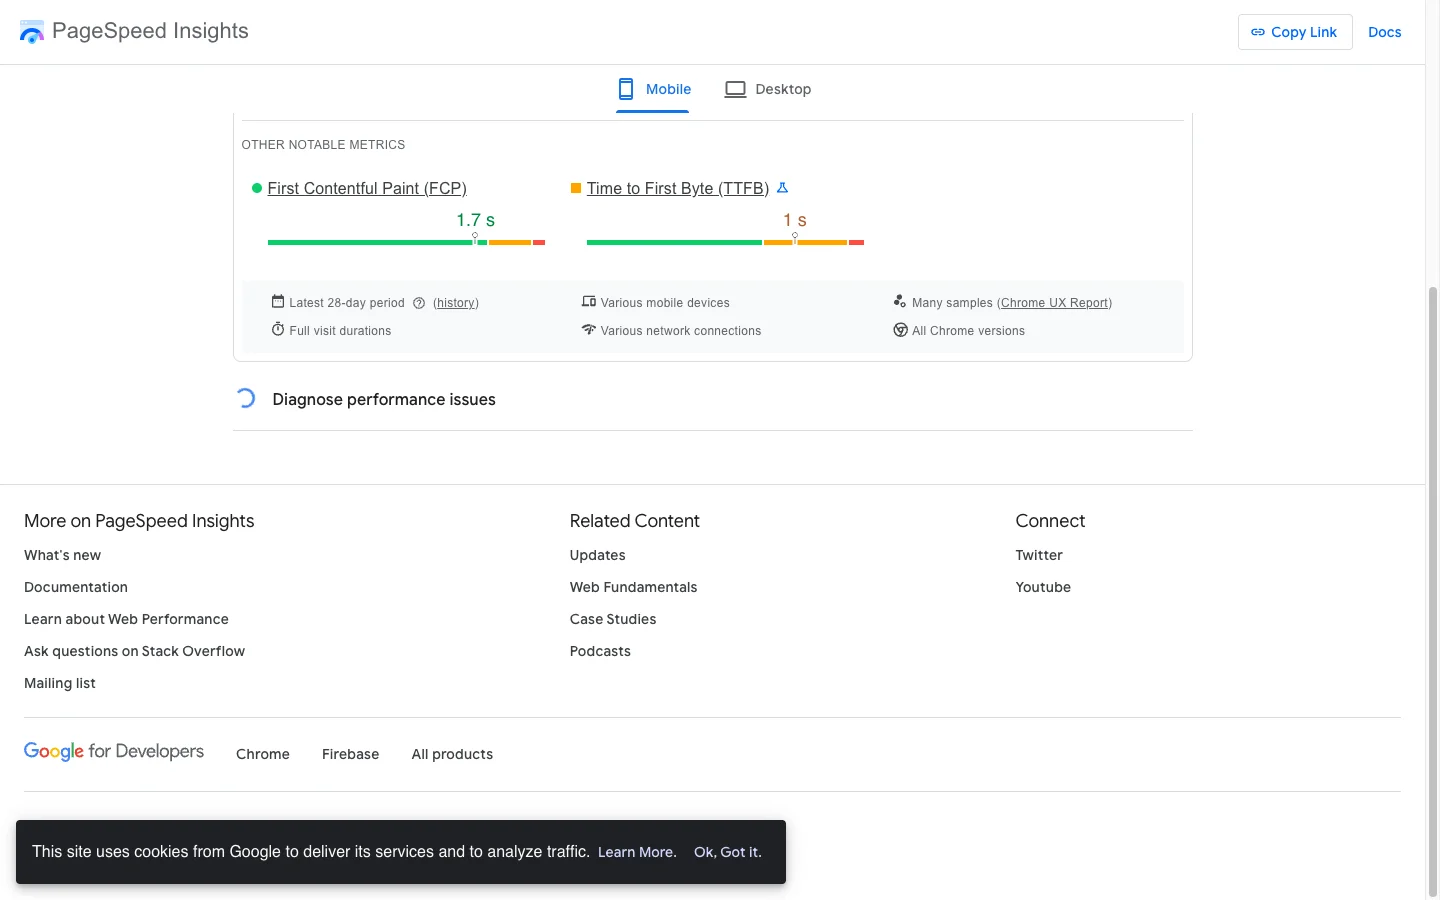
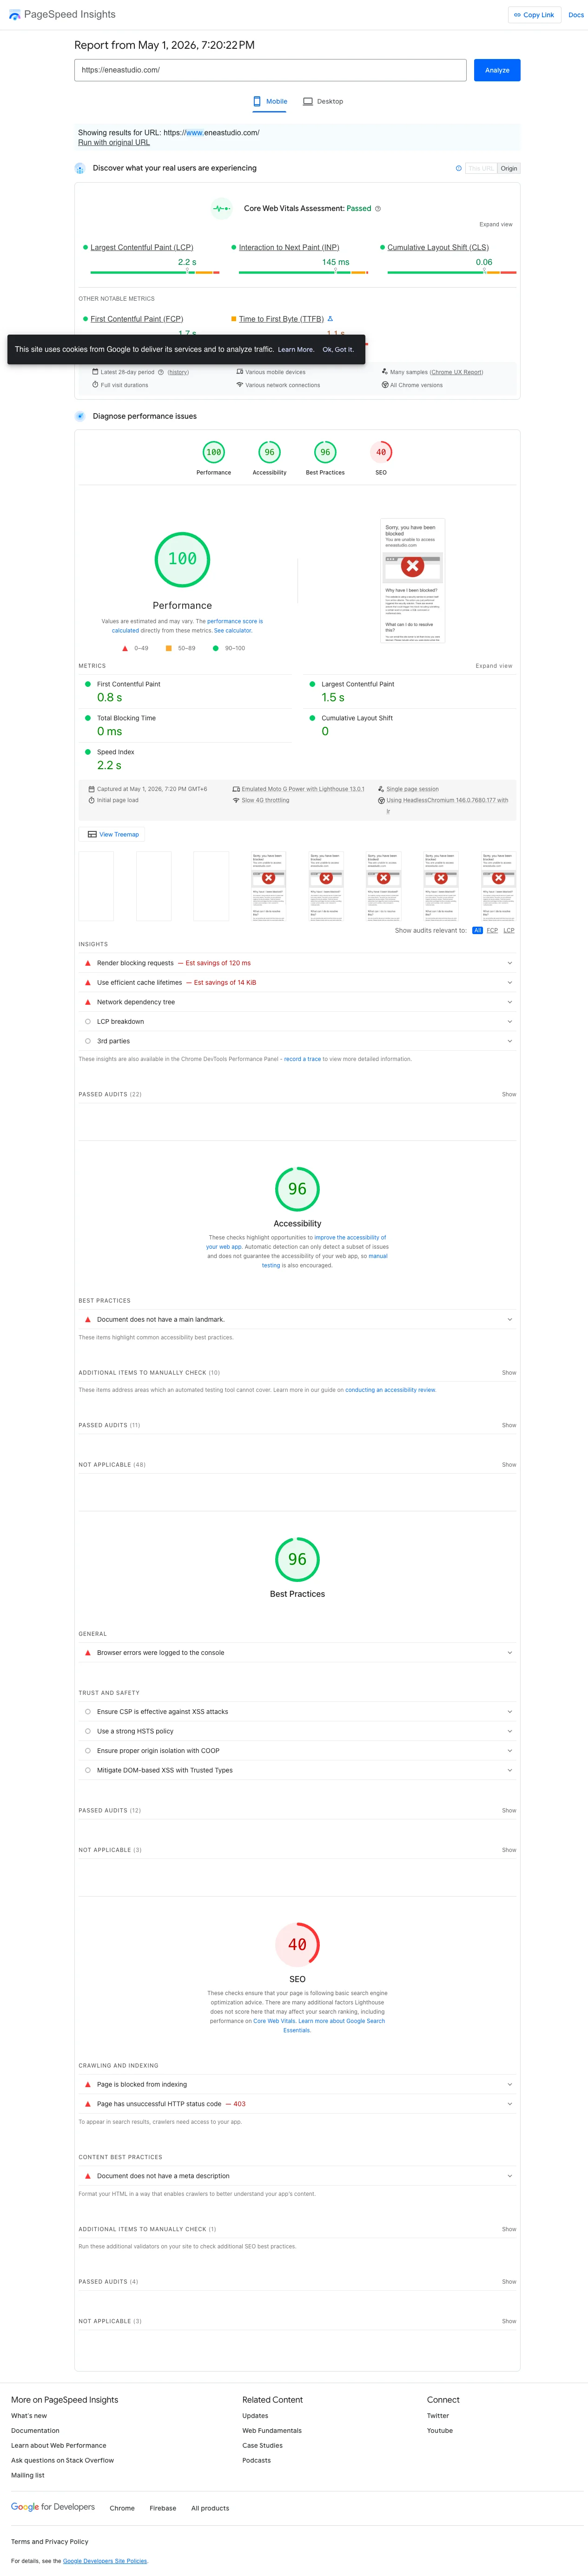
In March 2026 I ran PageSpeed Insights on a Shopify Plus PDP for Enea Studio, a luxury jewelry brand. Mobile Lighthouse scored 23 out of 100. The CrUX panel below it showed every Core Web Vital green: LCP 2.1s, INP 129ms, CLS 0.05, FCP 1.6s, TTFB 0.7s. Same URL. Same Chrome session.
The founder asked the obvious question. Are we broken or are we fine?
TL;DR: Lighthouse simulates one cold load on a throttled phone. CrUX aggregates 28 days of real Chrome users at the 75th percentile. Google ranks on CrUX, not Lighthouse. Shopify’s third-party app stack inflates the lab score while warm caches, BFCache, and real networks rescue the field score. For ranking, only CrUX matters. For regression hunting, only Lighthouse does.
Why this matters for your store
- A green CrUX dashboard is the only performance signal that protects organic traffic and Search Console rankings.
- Chasing a 90+ Lighthouse score on Shopify burns weeks of dev time that should go to AOV and CVR work.
- The wrong metric in your weekly report makes the team optimize for noise instead of revenue.
Lighthouse vs CrUX at a glance
| Dimension | Lighthouse | CrUX |
|---|---|---|
| Data type | Lab (synthetic) | Field (real users) |
| Sample | One simulated cold load | 28 days of real Chrome users |
| Aggregation | Single run | 75th percentile (p75) |
| Network | Throttled to 1.6 Mbps / 750 Kbps / 150ms RTT | Whatever real users have (4G, 5G, wifi) |
| CPU | 4x slowdown multiplier | Real device CPUs |
| Affects Google ranking? | No | Yes (Core Web Vitals signal) |
| Metrics reported | FCP, LCP, TBT, CLS, Speed Index, score 0-100 | LCP, INP, CLS, FCP, TTFB at p75 |
| Update latency | Instant | ~28 days for full rollover |
| Best use | Diagnose regressions, CI alarms | Confirm real-user impact, ranking health |
What Lighthouse actually measures
Lighthouse runs one deterministic audit on an emulated phone and returns a 0 to 100 score. It does not feed Google Search rankings. PageSpeed Insights, GTmetrix, and the Chrome DevTools panel all run the same engine.
The default mobile profile is intentionally pessimistic per Lighthouse’s throttling docs:
- Network: 1.6 Mbps down, 750 Kbps up, 150ms RTT, simulated via the Lantern engine
- CPU: 4x slowdown multiplier
- Cache: none, every run is cold
- Sample: one
The score weights are public on Chrome for Developers: TBT 30%, LCP 25%, CLS 25%, FCP 10%, Speed Index 10%. Total Blocking Time and Largest Contentful Paint own 55% of the score, and both punish render-blocking JavaScript on a single simulated CPU core.
A Shopify PDP carrying Klaviyo, a review widget, and a chat embed cannot escape this math. The 23 score is forced by arithmetic, not by a real user struggling.
To watch that cold load happen on your own store, run a Shopify speed test: it renders the first visit frame by frame on a phone and grades LCP, TBT, and Speed Index against Google’s thresholds.
What CrUX actually measures
CrUX is Google’s public dataset of real Chrome telemetry. Every opted-in visitor reports their LCP, INP, CLS, FCP, and TTFB back to Google. The numbers Google ships in Search Console and on pagespeed.web.dev come from this stream.
A user contributes to CrUX only when all four conditions hold (CrUX methodology):
- Usage statistic reporting on
- Browser history sync on
- No sync passphrase set
- Chrome on Windows, macOS, ChromeOS, Linux, or Android
CrUX excludes iOS Chrome entirely because Chrome on iOS uses WebKit, not Blink. It also drops Edge, Brave, Safari, and Android WebView. A store with heavy iPhone traffic is reporting on roughly half its real audience.
The reported figure is the 75th percentile across a 28-day rolling window, refreshed daily near 04:00 UTC. Origin-level data is almost always available. URL-level data needs more samples (community estimates put the floor near 1,000 monthly visits per device class).
You can see your own field data in three places:
- The field-data tab on pagespeed.web.dev
- Google Search Console under Page Experience and Core Web Vitals
- Shopify admin under Online Store > Performance
For a Shopify-specific view that pairs CrUX flags with Liquid fix snippets, my Shopify Core Web Vitals checker returns field data, lab opportunities, and the Liquid checklist on one screen.
Why Google ignores Lighthouse for ranking
Google ranks on CrUX because lab numbers can be tuned. Real-user data cannot. Vercel’s writeup puts it bluntly: “Google does not consider your Lighthouse score in any way for search ranking.” DebugBear confirms it.
That cuts both ways:
- A 100 Lighthouse score does not save you. If real users hit a 4-second LCP from regional CDN issues, CrUX sees it and your ranking reflects it.
- A 23 Lighthouse score does not sink you. If real users hit 2.1-second LCP from warm caches and BFCache, the page experience signal stays positive.
Shopify itself published Common Misconceptions About Site Speed Score, then retired the Lighthouse-derived speed grade from admin and replaced it with a CrUX-driven Web Performance dashboard. When the platform stops trusting the lab number, copy them.
Why a single Lighthouse run swings 15 points
Lighthouse is one sample from a noisy distribution. The official variability doc names seven noise sources: page nondeterminism, last-mile network jitter, tier-1 hops, server warm-up state, laptop thermal throttling, browser extensions, and V8 JIT timing. Google states that the median of five runs is twice as stable as one.
I see 5 to 10 point swings between back-to-back PSI clicks on the same URL constantly. Tools like DebugBear and WebPageTest ship dedicated controlled hardware and median across many runs. Use those if you need a stable lab number to gate a deploy. Otherwise, run Lighthouse five to nine times in each state and compare medians. Anything else is noise dressed up as a measurement.
Why Shopify magnifies the gap
The Hyperspeed audit of 1,166 Shopify stores is the cleanest public dataset on Shopify performance:
- Average mobile PageSpeed score: 30 out of 100
- Average LCP: 11.9 seconds
- Average TBT: 8.8 seconds
- Average page weight: 11.0 MB
- Scripts per store: 120+
- 97% of stores skip preloading the LCP image
- 72% still ship JPEG or PNG instead of WebP or AVIF
Per-app cost numbers I have logged across recent audits:
- Klaviyo onsite: ~150ms+ per pageview, main loader spawns ~23 child scripts at ~1.2s combined execution
- Yotpo: 250 to 450ms per page, four scripts at ~240 KB
- Judge.me: ~30 to 60 KB total, near-zero lab impact
- Rebuy: ~172ms blocking time
- Microsoft Clarity: ~95ms, present on 42% of stores
- Gorgias chat: ~2,200ms total weight where present
These scripts hammer Lighthouse because most are render-blocking until proven otherwise (Shopify’s own ParserBlockingJavaScript theme check exists for this reason), they all run on one simulated CPU core under 4x throttling, and Shopify App Embeds inject globally by default. CrUX rarely sees the same damage. Real visitors arrive with warm DNS, persistent HTTP/2 connections, cached chunks, and BFCache hits on back navigation. The cold-load pessimism that punishes Lighthouse simply does not apply.
For deeper Liquid-level fixes, see my Core Web Vitals optimization guide, the Liquid loop optimization post, and popups killing conversions.
How to close the gap on Shopify
Run these eight steps in order. Total time on a typical store is roughly six hours.
- Audit installed apps. Cap the working set at 6 to 8 apps. Check Online Store > Themes > Edit code for orphaned snippets after every uninstall. The detect the apps any Shopify store runs does the heavy lifting here, naming each detected app and sorting by main-thread cost so the cap-to-eight decision is data-driven.
- Scope app embeds per template. Disable review widgets and chat on cart, account, and checkout-adjacent pages.
- Defer all non-critical third-party scripts. Add async or defer to Klaviyo, GTM, Clarity, Gorgias, Privy.
- Self-host the one or two above-fold fonts. Set
font-display: swapand add a singlerel=preloadfor the hero woff2. - Preload the LCP image with srcset. Use
image_urlwithimagesrcsetandimagesizeson arel=preloadtag. 97% of audited Shopify stores skip this. - Audit popup boot cost. Defer Klaviyo and Privy popups to first interaction or
requestIdleCallback. - Lazy-load below-fold images. Combined with proper srcset this cuts mobile LCP 0.5 to 1.5 seconds.
- Verify in CrUX after 28 days. Lighthouse moves immediately and noisily. CrUX is the confirmation that matters.
Step zero, before any of these: pull your CrUX data. If field is already green, your Lighthouse score is a vanity metric.
How to verify the fix in 5 minutes
Step 1: Open pagespeed.web.dev, paste your PDP URL, screenshot the field-data panel. This is your baseline.
Step 2: Open Search Console > Page Experience > Core Web Vitals. Note any URL groups flagged as Poor or Needs Improvement.
Step 3: Wait 28 days after deploy, then repeat steps 1 and 2. If the CrUX p75 numbers move into green, the fix worked. If Lighthouse moved but CrUX did not, the fix targeted the wrong layer.
Lab vs field across recent client work
- Enea Studio: Lighthouse 23, CrUX all green. App stack created the gap.
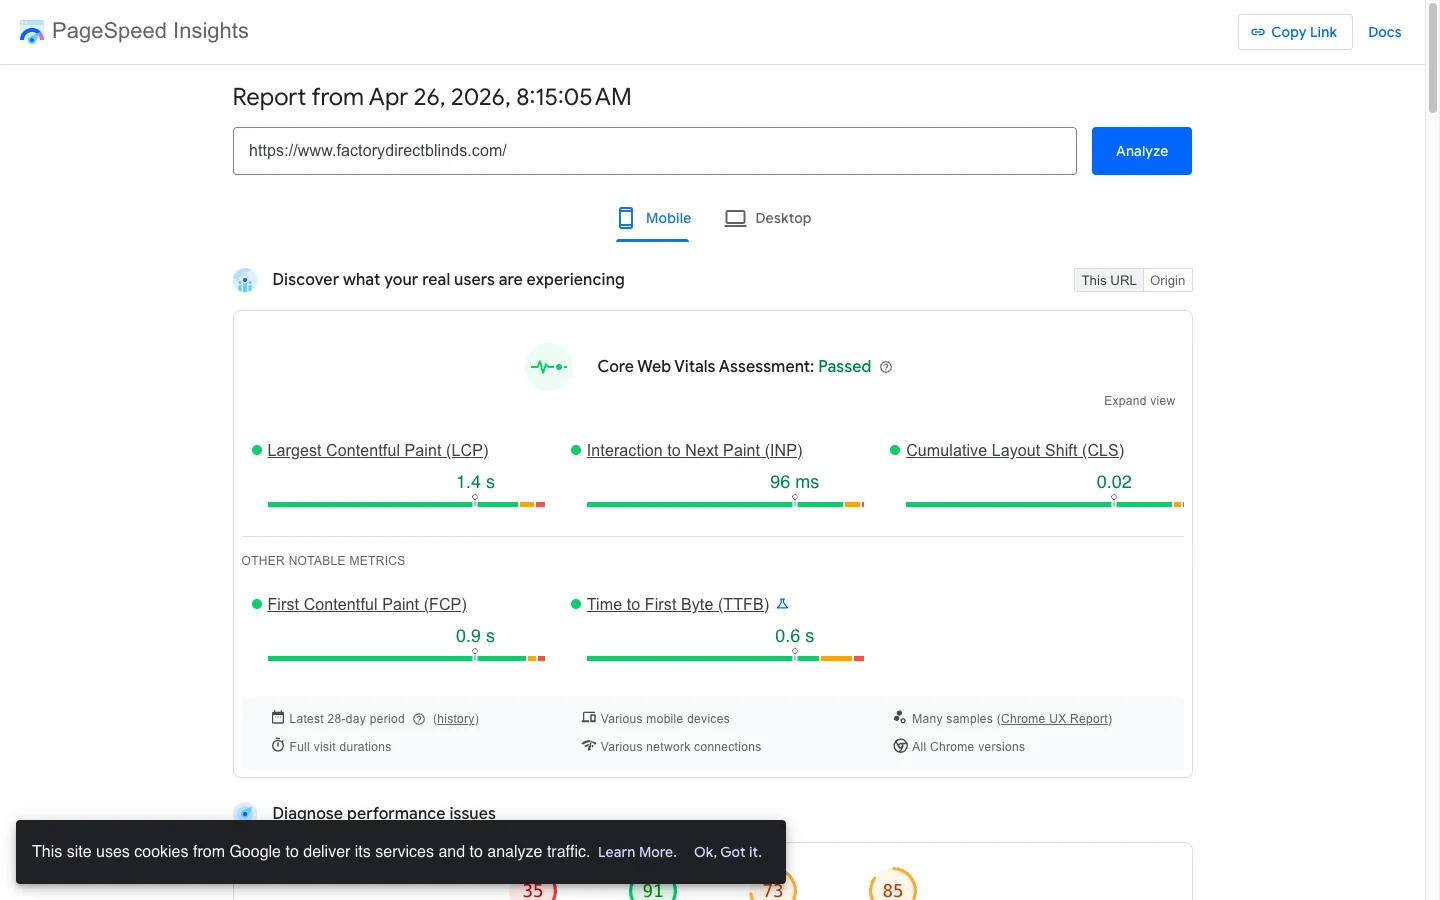
- Factory Direct Blinds: PageSpeed 38 to 81, LCP 22.0s to 2.7s. Both signals moved.
- WD Electronics: Lighthouse 41, LCP 9.3s. Lab flagged genuine pain.
- Teeth Whitening DTC: Lighthouse 64, TBT 1,250ms (6x threshold). Mid-band, genuinely diagnostic.
Lighthouse helps in the 30 to 60 range when CrUX shows correlated pain. It misleads in the 20s with green field or the 90s with red field. Read both signals.
The takeaway
- Trust CrUX for ranking, executive reporting, and post-deploy verification.
- Use Lighthouse for regression hunting, CI alarms, and hypothesis generation.
- Median 5 to 9 Lighthouse runs before quoting any number; one click is noise.
- Cap your Shopify app stack at 6 to 8 active apps and defer every non-critical script.
- Verify every performance fix in CrUX 28 days later, never on the lab number alone.
If your Shopify store has a Lighthouse score that does not match what Search Console shows for Core Web Vitals, book a free 30-minute strategy call. I will run PSI with you live on a representative URL and tell you whether the gap is safe to ignore or hiding a real fix.