

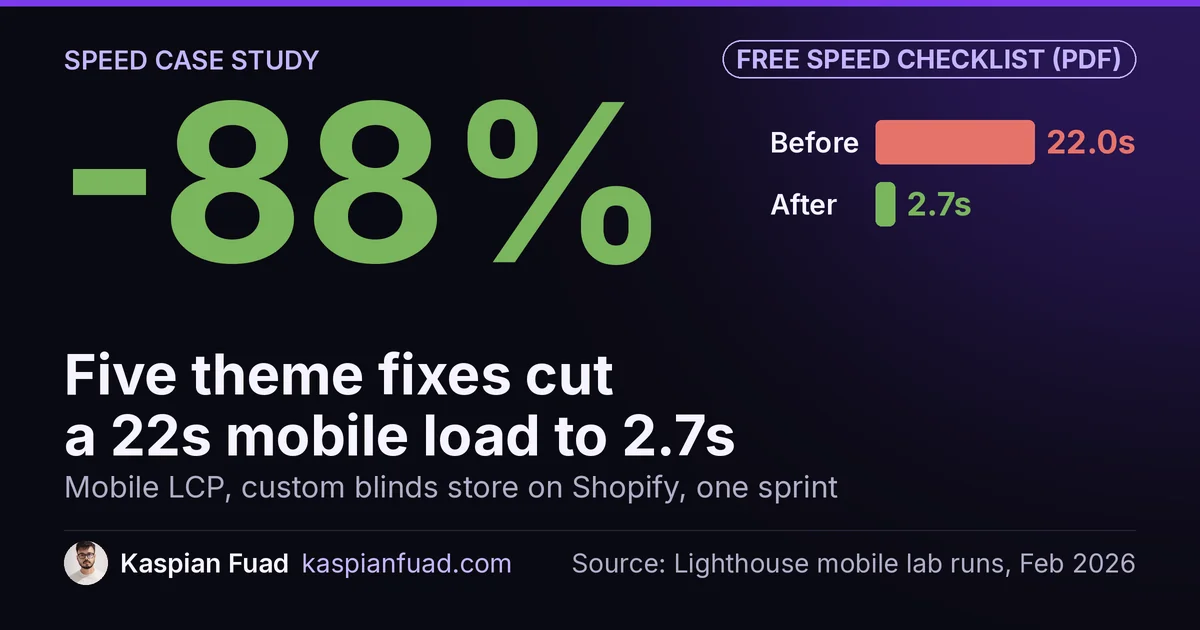
TL;DR: A US custom blinds store on Shopify went from a mobile PageSpeed score of 38 to 81 in one performance sprint. Mobile LCP fell from 22.0s to 2.7s and Total Blocking Time from 2,290ms to 480ms; desktop went from 48 to 99. Five changes did it: images, scripts, CSS, fonts and conditional loading. The score stopped at 81 because the product builder’s JavaScript still blocked the main thread.
The store’s product builder loaded its JavaScript and CSS on every page. Blog posts, collection pages, the homepage: all of them downloaded a configurator that only a product page uses.
This is for a Shopify owner with a mobile score in the 30s, deciding whether a speed project is worth paying for. Below is the real engagement with every before and after number, the code pattern behind each fix, and one honest limit: the speed work shipped next to CRO changes, so I cannot hand you a revenue number for speed alone.
Download the Shopify mobile speed fix checklist (PDF)
Why this matters for your store
- Check your mobile LCP first: at 22 seconds, most phone visitors leave before the product appears.
- Expect desktop to look fine while mobile fails, which hides the problem from anyone testing on a laptop.
- Budget for the theme work, because a speed app cannot remove code your theme loads on purpose.
What was slow on a Shopify store scoring 38 on mobile?
The store sells made-to-measure blinds, so its product pages carry a heavy configurator: material, color, size, mount and extras, priced live. When I started, mobile Lighthouse scored 38 and desktop 48. Both failed Core Web Vitals.
Here is the mobile lab run before the sprint:
| Metric (mobile) | Before | Google’s “good” line |
|---|---|---|
| Performance score | 38 | 90+ |
| Largest Contentful Paint | 22.0s | 2.5s or less |
| Total Blocking Time | 2,290ms | under 200ms |
| Speed Index | 5.9s | (no fixed line) |
The thresholds come from Google’s own LCP guidance and TBT guidance. A 22-second LCP is almost nine times the “good” line.
The server was not the problem. The store’s response times were fine; the time went into what the browser downloaded and ran after the first byte arrived. That matters for the fix list, because a host upgrade or a “speed booster” app would have changed nothing.
The audit also found a 62% gap between mobile and desktop add-to-cart rates. Slow loading was one cause. The configurator’s desktop-first layout on a phone was another, and that got its own sprint.
Which 5 changes took mobile PageSpeed from 38 to 81?
Each fix targets one Lighthouse metric. That matters because Lighthouse 10 weights the score unevenly: Total Blocking Time is 30%, LCP and CLS 25% each, First Contentful Paint and Speed Index 10% each. TBT and LCP are where the points are.
1. Stop lazy-loading the hero, and stop shipping 3000px images
The above-fold images used loading="lazy", and the theme had no eager exception. Google’s LCP optimization guide names exactly this as a way to delay your LCP image, because the browser waits for layout before it even requests the file. The theme also served 3000px originals to phones that needed about 400px.
The fix was eager loading for the first section, a real srcset, and a 1200px cap on hero images. With Shopify’s image_tag filter, the pattern looks like this:
sections/hero.liquid
{%- liquid
  assign loading = 'lazy'
  if section.index == 1
    assign loading = 'eager'
  endif
-%}
{{ section.settings.image
  | image_url: width: 1200
  | image_tag: loading: loading, widths: '400, 800, 1200', sizes: '100vw' }}
section.index is 1 for the first section on the page, so only the image the visitor sees first loads eagerly. Everything below the fold stays lazy.
2. Defer third-party scripts and delete dead app code
Chat widgets, analytics and marketing pixels loaded in the head as blocking scripts. I moved the non-critical ones to defer or async, so the browser parses the page first.
The bigger win was deletion. App code that nothing used anymore was still loading on every page type. Uninstalling an app does not always remove what it injected into the theme, so I check theme.liquid and the snippets folder by hand on every audit. My guide to deferring third-party scripts covers which scripts are safe to defer and which break when you do.
3. Inline the critical CSS, defer the rest
The full stylesheet blocked first paint. I inlined the above-fold CSS in the head and loaded the rest with the media="print" swap that web.dev documents:
layout/theme.liquid
<link rel="stylesheet" href="{{ 'theme.css' | asset_url }}"
  media="print" onload="this.media='all'">
<noscript><link rel="stylesheet" href="{{ 'theme.css' | asset_url }}"></noscript>
The noscript line keeps the page styled for the rare visitor without JavaScript.
4. Swap fonts instead of blocking on them
Google Fonts loaded without font-display: swap and without preconnect hints, so text waited on the font file. Adding swap plus preconnect and preload let the text paint in a fallback font first. If you go further and self-host fonts, my font loading and CLS guide shows how to stop the swap from shifting the layout.
5. Load the product builder only where it runs
This is the fix from the hook. The builder’s JavaScript and CSS loaded on every template. Wrapping them in a template check cut them from every page that is not a product page:
layout/theme.liquid
{%- if template.name == 'product' -%}
  {{ 'builder.css' | asset_url | stylesheet_tag }}
  <script src="{{ 'builder.js' | asset_url }}" defer></script>
{%- endif -%}
The file names here are placeholders; the pattern is the point. Collections and blog posts stopped paying for code they never ran.
What did the before and after numbers look like?
These are the Lighthouse lab runs from when the sprint wrapped in February 2026:
| Metric | Before | After | Change |
|---|---|---|---|
| Mobile score | 38 | 81 | +113% |
| Mobile LCP | 22.0s | 2.7s | -88% |
| Mobile TBT | 2,290ms | 480ms | -79% |
| Mobile Speed Index | 5.9s | 3.5s | -41% |
| Desktop score | 48 | 99 | +106% |
| Desktop TBT | 460ms | 0 to 10ms | near zero |
Desktop almost maxed out. Mobile did not, and the reason is the most useful part of this case study.
Why did the mobile score stop at 81 and not 95?
Look at TBT: 480ms after the sprint. That is still more than double the 200ms “good” line, and TBT carries 30% of the score. The remaining blocking time came from the product builder itself, a 6,221-line jQuery file that ran on every product page.
You cannot defer your way out of that. The builder has to run for the shopper to configure a blind, so the only real fix is a smaller, faster builder. That became a later sprint: I rebuilt it as a modular core with per-product modules, loaded only for the product type on screen.
This is the honest ceiling for a lot of stores. Images, fonts and app leftovers are quick points. The last stretch of TBT usually lives in a custom feature the store needs, and fixing it is development work, not optimization.
Which number does Google use: the lab score or field data?
Field data. Google’s page experience documentation points to Core Web Vitals measured on real visits, which PageSpeed Insights shows from the Chrome UX Report in its top panel. The 0 to 100 score below it is a single simulated run.
Here is the store’s homepage report from April 26, 2026:
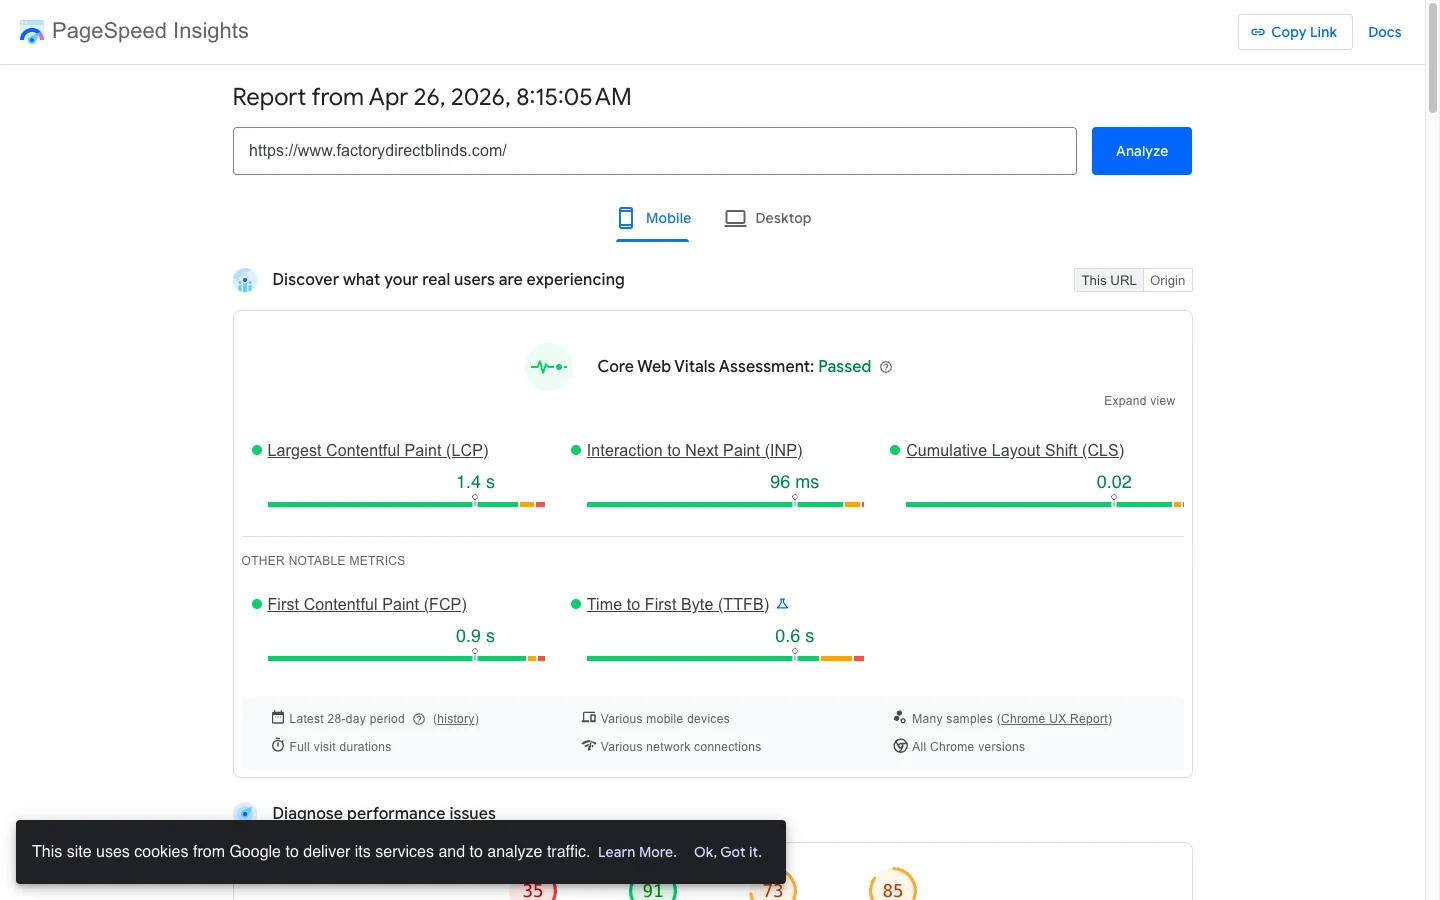
Real Chrome users over 28 days: LCP 1.4s, INP 96ms, CLS 0.02. Passed on all three. In the same report, the lab Performance score at the bottom read 35.
That is not a contradiction. A Lighthouse run throttles one simulated phone and moves from run to run, while field data averages thousands of real visits. Google explains the gap in its lab and field data guide, and I wrote up how Lighthouse and CrUX disagree on Shopify in more detail. Use the lab score to find problems. Use the field panel to decide whether you fixed them.
Did the faster store sell more?
I will not claim a number I cannot isolate. The speed sprint shipped in the same engagement as a mobile builder redesign and a measurement-guarantee upsell, so any sales change has several causes.
What the outside research says: a Deloitte study of mobile sites over four weeks found a 0.1 second speed improvement lifted retail conversions by 8.4% and average order value by 9.2%. This store cut 19.3 seconds off mobile LCP. Speed was clearly not its only problem, but a visitor who leaves before the configurator loads never reaches the rest of the funnel.
How long does Shopify speed optimization take, and what does it cost?
This was one focused sprint inside a four-month retainer. In my experience, image and font fixes show results within days. Script and CSS work takes longer, because every deferred file has to be tested on a live product page, on Chrome desktop, Safari on iOS and Chrome on Android, before it ships.
Price depends on how many apps you run and how custom the theme is. I charge a published $50 an hour and scope each store on its real app and theme load. My guide to hiring a Shopify speed optimization service covers the ranges and the red flags, including the sub-$100 gigs that only compress images.
How do you check your own store in 5 minutes?
- Run your homepage and one product page through PageSpeed Insights on mobile. Read the field panel at the top first. If it says “Failed”, note which metric.
- In the “Diagnose” section, find the LCP element. If it is an image with
loading="lazy"in your theme code, you have fix number 1. - Open a blog post with Chrome DevTools, go to the Network tab, filter by JS, and reload. Any file named after a product feature (builder, bundle, swatch, configurator) loading there is fix number 5.
For a quicker read, my first-visit mobile speed scan runs the cold-load check for you.
Fix the hero image this week. It is the cheapest point on the list, and it is the one I find broken most often in audits.
The takeaway
- Measure mobile, not desktop: this store scored 99 on desktop while mobile LCP sat at 22 seconds.
- Load the first-section image eagerly and cap hero images at 1200px.
- Delete unused app code before you defer anything else.
- Scope feature JavaScript to the templates that use it.
- Judge the result by field Core Web Vitals, because the lab score swings from run to run.
I am Kaspian Fuad, a Shopify developer and CRO consultant. I publish the before and after numbers from my own engagements, including where the work stopped short. If your mobile score is in the 30s, send me your store URL and I will tell you which of these five fixes to start with.