

TL;DR: A Shopify product page that gets traffic but not add-to-carts is failing at one of seven points, and they are mechanical before they are creative: the buy button below the fold on mobile, a broken product form, popups eating the first taps, an ad that promises what the page does not show, a price with no shipping or installment context, a trust gap the price cannot survive, or a slow page. Check them in that order. On one store that sequence lifted add-to-cart 41% and sales 51%; on another, add-to-cart 28% on flat traffic.
Mobelglede, a Norwegian furniture marketplace, came to me with Meta ads that were working, 75% of traffic on mobile, and a mobile conversion rate of 0.11%. The add-to-cart rate on product pages was 1.6%. The obvious answer was a redesign. The actual problem, found in Microsoft Clarity in an afternoon, was that 21% of mobile visitors left before the add-to-cart button entered the viewport, and 56% of the taps that did happen were spent closing a cookie banner and an email popup. Nobody redesigns their way out of that. You move a button and delete a popup.
That pattern repeats. The product page is where the money is decided, and Baymard’s product page research rates 51% of ecommerce sites mediocre or worse on it. But “mediocre” hides the useful truth: most of the failures are specific, cheap to find, and cheap to fix. Below is the order I check them in.
Download the Product Page Teardown Checklist (PDF)
Why this matters for your store
- Moving a page from 4% to the 4.6% Shopify average is 15% more carts from traffic you have already paid for.
- Paid traffic that bounces off the product page is the most expensive traffic you buy, because you paid for the click and the pixel learned nothing.
- A product page fault is usually one fix, a few hours of work, and it compounds across every product using that template.
Is my Shopify product page actually the problem?
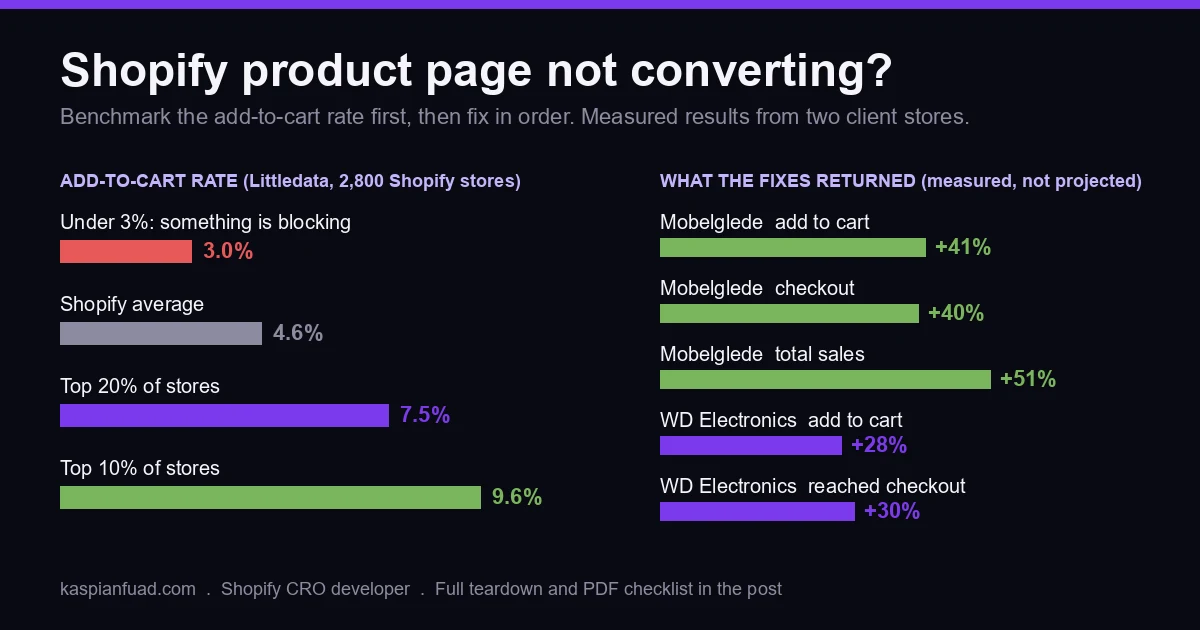
Start with the number, not the page. Shopify defines added to cart rate as sessions with cart additions divided by total sessions, and it is in the Conversion summary of every store’s analytics. Littledata’s benchmark across 2,800 stores puts the Shopify average at 4.6%; above 7.5% is the top 20%, above 9.6% the top 10%.
So 4% is not a disaster. It is a store slightly under average with a specific leak. Under 3% on product-page traffic is different: that is a page where something is physically stopping people, and it is the range where the big lifts live.
Then split traffic from page. Open the funnel by landing page and by device. If desktop converts at 2% and mobile at 0.4%, the page is failing on the phone, not everywhere. If one product runs a 9% add-to-cart rate and the rest run 2%, the template is fine and the other products are missing what the winner has. If cold Meta traffic runs 1% and returning visitors 8%, you may have a traffic and message problem rather than a page problem. Ten minutes in the funnel report tells you which of these you have, and each one has a different fix.
Why is my Shopify product page not converting?
Seven causes, in the order I check them, cheapest and most common first.
The buy box is below the fold on mobile. This is the single most common fault I find. On Mobelglede the scroll heatmap showed 21% of visitors gone before the add-to-cart button appeared, and a third gone by the halfway mark. Oversized images and 3rem of dead margin under the gallery had pushed the button to the second screen. Tightening the spacing and adding a sticky add-to-cart bar put the action one tap away at every scroll depth.
The product form is broken for some visitors. Not for you, for some of them. On WD Electronics, a Shopify Plus automotive store, every single-variant product showed an Unavailable button instead of Add to cart, and accessory products added the wrong variant. A third bug, a JavaScript error in the cart, hit 190 sessions before anyone noticed. All three passed a visual review because the reviewer looked at a multi-variant bestseller on desktop. Dawn-based themes render “Unavailable” whenever the selected variant does not resolve, which one unpublished variant or one broken option map will do.
Overlays eat the first taps. On Mobelglede, 56% of all mobile taps went to the cookie consent and an Omnisend popup, which fired on product pages and produced zero signups from them. Shoppers were spending their session dismissing things. Converting the consent to a bottom bar and disabling the popup on product pages freed those taps for shopping, and it is the change that fired first in the results.
The ad does not match the page. A Meta ad that shows a green kit at $49 with free shipping, landing on a page that defaults to black, shows $59, and mentions shipping nowhere, has broken the promise before the shopper reads a word. The fix is a variant-specific landing URL and the same claim, image and price above the fold. This is a traffic fault that looks like a page fault, and the by-source split in the funnel report is how you tell.
The price has no context. Baymard’s UX statistics find 43% of sites give no shipping information on the product page while 64% of users look for it there, and 47% of sites show no in-scale image. On WD Electronics, products in the $415 to $1,099 range showed no installment messaging while the competitor next door displayed Klarna on every page. A high-ticket price with no “or 4 payments of”, no shipping line, and no photo with a human in it is a price the shopper cannot evaluate, so they leave to evaluate it elsewhere.
The trust gap is wider than the price. A DTC teeth-whitening brand I audited had four reviews on its hero product while MySweetSmile showed 7,500 and Hismile 21,000. The formula was better for sensitive teeth and cheaper per treatment, but the page said neither. In a category where the product goes in your mouth, that gap is the whole decision. Reviews, a guarantee, and one line of specificity about why this product beat the alternative belong beside the button, not in a tab.
The page is slow or heavy. On Enea Studio, collection-scoped product URLs loaded an 18,439 KB payload, four times the homepage, with a size-chart app script running on every page and a Klarna widget throwing currency errors. On WD Electronics, mobile LCP on the product page went from 2.06 seconds to 0.736 once app weight and layout shift were cleaned up, well under Google’s 2.5 second threshold. Shopify’s own theme performance guidance is blunt that app and theme JavaScript compete for the same main thread, and the product page carries more apps than any other template. Run yours through the App Bloat Detector and you will see which ones.
How do I find which one it is in an afternoon?
Five checks, in order, and change nothing until all five are done.
- Read Shopify’s conversion funnel by product, by device and by traffic source for the last 28 days. Note which slice has the low add-to-cart rate. That slice names the suspect.
- Install Microsoft Clarity and give it 48 hours. Read the scroll heatmap on your top three product pages on mobile: what percentage of visitors are still there at the add-to-cart button? Then the click heatmap: what are the top five tapped elements? If any of them is a popup, that is finding one.
- Open your top five products on a real phone. Select every variant, change quantity, add to cart, open the cart drawer, reach checkout. Then open the browser console on the product page and read the red lines. A product form that throws an error is a product form that is failing for someone.
- Open your best-performing Meta ad and the page it lands on side by side. Same product image, same price, same shipping claim, same variant pre-selected? Every mismatch is a leak.
- Run the top product page through PageSpeed Insights on mobile and read the field data, not the lab score. LCP over 2.5 seconds or CLS over 0.1 is a cause on its own.
By the end you will usually have two or three named faults. Fix them one at a time, a few days apart, so you can see which one moved the number. Twenty changes in one afternoon is a redesign, and a redesign teaches you nothing.
What does fixing the product page actually return?
Here are the numbers from the two stores above, measured, not projected.
Mobelglede, from a 0.11% mobile baseline and a 1.6% add-to-cart rate: popups fixed, mobile product page rebuilt, trust signals moved beside the button, sticky bar added. Over the first 30 days against the prior period, add-to-cart rose 41%, checkout completion 40%, and total sales 51%. The full teardown and the case study carry the Clarity data and the 43 audit findings.
WD Electronics, an established Shopify Plus store, is the more honest comparison for a healthy brand. Over eight weekly sprints on roughly flat traffic (sessions up 4%), added to cart rose 28% and reached checkout rose 30%, with the product form bugs, the cart layout shift and the speed work each landing in its own week. Details are in the WD Electronics case study.
Set your expectation from your baseline. A store already near the 4.6% average should plan for a 10 to 20% relative lift from product page work, and most of it comes from the first two or three fixes. A store under 3% has real headroom, and 40% is not unusual, because you are removing a wall rather than tuning a page.
Should I redesign the product page or fix it?
Fix it. Most product page advice gets this backwards because a redesign is what agencies sell and a bug fix is not.
A redesign changes the layout, the copy, the images, the apps and the template in one release. If the add-to-cart rate moves, you do not know why; if it does not move, you have spent the redesign budget to learn that the fault was somewhere else. Mobelglede did not need a new page. It needed the old one to render its button in the first viewport and to stop asking for an email address on a product page.
Redesign after the fixed page has run four clean weeks and still sits under the average. At that point you know the mechanics are sound and the page is underselling, and that is a design and copy problem worth paying for. Before that point, a redesign is an expensive way to avoid reading a heatmap.
Who should I hire to fix a Shopify product page?
A Shopify CRO specialist who can also write theme code. One person who reads the funnel report, finds the fault in Clarity, opens the theme, and ships the fix.
The reason is the seven causes above. Two are analytics problems, two are theme code problems, one is an ad problem, one is a UX problem and one is a performance problem. A designer sees the UX one. A general developer sees the code ones. A CRO agency sees all seven and hands you a testing roadmap, then bills a retainer to work through it a month at a time. You want the person who fixes the Unavailable button on Tuesday and moves the buy box on Wednesday, then measures.
Ask one thing before you hire anyone: “Show me three product page changes you shipped, with the add-to-cart rate before and after.” If the answer is a portfolio of screenshots, keep looking. Expect a fixed-scope product page audit at $500 to $2,500, delivered in 2 to 3 days, and a few hours of senior time at $50 to $75 an hour for the fixes. My published rates sit at the low end of that, and the agency versus freelancer comparison shows where each option pays off.
How to verify in 5 minutes
Open your Shopify analytics, set the range to 28 days, and read added to cart rate by device. Then open your top product on your own phone, in Safari or the Instagram in-app browser, and count the scrolls to the add-to-cart button. If it is more than one, or the rate on mobile is under 3%, you have found your first fix and you have not spent a dollar.
The takeaway
- Read the funnel by device, product and source before touching the page. The low slice names the fault.
- Put the buy button in the first mobile viewport and add a sticky bar for the long pages.
- Test the product form on a real phone with the console open, every variant, every quantity.
- Kill popups on product pages and shrink the cookie banner; on one store they took 56% of taps.
- Fix before you redesign. One change at a time, a few days apart, measured against the prior period.
I am Kaspian Fuad, a Shopify developer and CRO consultant. I fix product pages by finding the fault in the data, shipping the change in theme code, and measuring the add-to-cart rate until it moves. If your product page gets traffic and not carts, book a call and bring the funnel report.